French vs Mexican American Indian 4th Grade
COMPARE
French
Mexican American Indian
4th Grade
4th Grade Comparison
French
Mexican American Indians
98.3%
4TH GRADE
100.0/ 100
METRIC RATING
28th/ 347
METRIC RANK
95.8%
4TH GRADE
0.0/ 100
METRIC RATING
328th/ 347
METRIC RANK
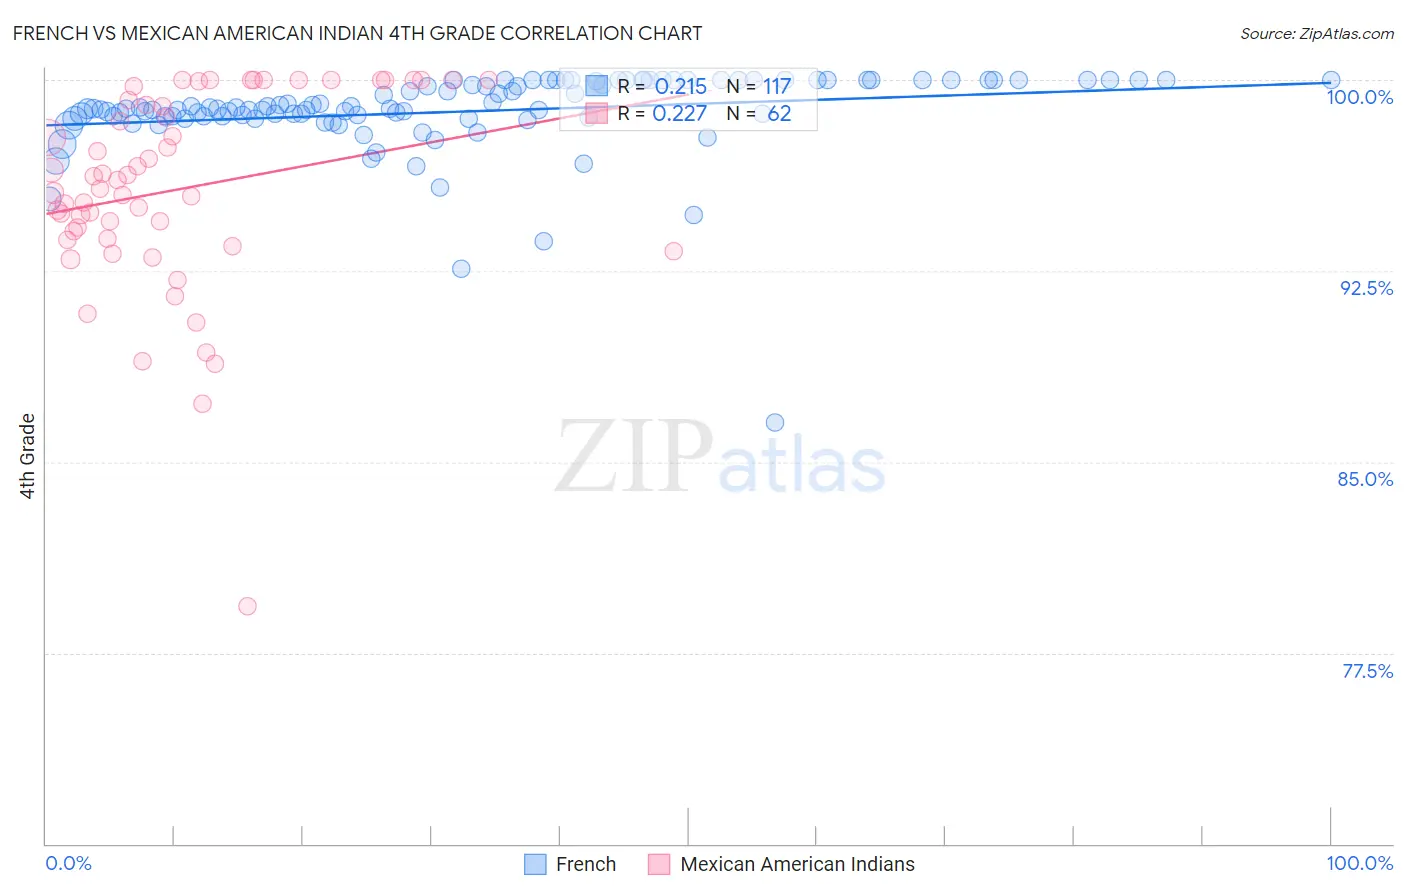
French vs Mexican American Indian 4th Grade Correlation Chart
The statistical analysis conducted on geographies consisting of 572,427,269 people shows a weak positive correlation between the proportion of French and percentage of population with at least 4th grade education in the United States with a correlation coefficient (R) of 0.215 and weighted average of 98.3%. Similarly, the statistical analysis conducted on geographies consisting of 317,621,104 people shows a weak positive correlation between the proportion of Mexican American Indians and percentage of population with at least 4th grade education in the United States with a correlation coefficient (R) of 0.227 and weighted average of 95.8%, a difference of 2.6%.
4th Grade Correlation Summary
| Measurement | French | Mexican American Indian |
| Minimum | 86.6% | 79.3% |
| Maximum | 100.0% | 100.0% |
| Range | 13.4% | 20.7% |
| Mean | 98.8% | 95.7% |
| Median | 98.9% | 95.9% |
| Interquartile 25% (IQ1) | 98.5% | 93.8% |
| Interquartile 75% (IQ3) | 100.0% | 99.2% |
| Interquartile Range (IQR) | 1.5% | 5.5% |
| Standard Deviation (Sample) | 1.7% | 3.9% |
| Standard Deviation (Population) | 1.7% | 3.9% |
Similar Demographics by 4th Grade
Demographics Similar to French by 4th Grade
In terms of 4th grade, the demographic groups most similar to French are French Canadian (98.3%, a difference of 0.0%), Croatian (98.3%, a difference of 0.010%), Czech (98.3%, a difference of 0.010%), Danish (98.3%, a difference of 0.020%), and Scotch-Irish (98.3%, a difference of 0.020%).
| Demographics | Rating | Rank | 4th Grade |
| Lithuanians | 100.0 /100 | #21 | Exceptional 98.3% |
| Finns | 100.0 /100 | #22 | Exceptional 98.3% |
| Sioux | 100.0 /100 | #23 | Exceptional 98.3% |
| Danes | 100.0 /100 | #24 | Exceptional 98.3% |
| Scotch-Irish | 100.0 /100 | #25 | Exceptional 98.3% |
| Croatians | 100.0 /100 | #26 | Exceptional 98.3% |
| French Canadians | 100.0 /100 | #27 | Exceptional 98.3% |
| French | 100.0 /100 | #28 | Exceptional 98.3% |
| Czechs | 100.0 /100 | #29 | Exceptional 98.3% |
| Scandinavians | 100.0 /100 | #30 | Exceptional 98.3% |
| Europeans | 100.0 /100 | #31 | Exceptional 98.3% |
| Chinese | 100.0 /100 | #32 | Exceptional 98.3% |
| Swiss | 100.0 /100 | #33 | Exceptional 98.2% |
| Chippewa | 100.0 /100 | #34 | Exceptional 98.2% |
| Italians | 100.0 /100 | #35 | Exceptional 98.2% |
Demographics Similar to Mexican American Indians by 4th Grade
In terms of 4th grade, the demographic groups most similar to Mexican American Indians are Immigrants from Cambodia (95.8%, a difference of 0.010%), Immigrants from Fiji (95.8%, a difference of 0.020%), Immigrants from Armenia (95.8%, a difference of 0.070%), Immigrants from Honduras (95.8%, a difference of 0.080%), and Honduran (96.0%, a difference of 0.11%).
| Demographics | Rating | Rank | 4th Grade |
| Japanese | 0.0 /100 | #321 | Tragic 96.0% |
| Immigrants | Vietnam | 0.0 /100 | #322 | Tragic 96.0% |
| Immigrants | Nicaragua | 0.0 /100 | #323 | Tragic 96.0% |
| Immigrants | Belize | 0.0 /100 | #324 | Tragic 96.0% |
| Dominicans | 0.0 /100 | #325 | Tragic 96.0% |
| Hispanics or Latinos | 0.0 /100 | #326 | Tragic 96.0% |
| Hondurans | 0.0 /100 | #327 | Tragic 96.0% |
| Mexican American Indians | 0.0 /100 | #328 | Tragic 95.8% |
| Immigrants | Cambodia | 0.0 /100 | #329 | Tragic 95.8% |
| Immigrants | Fiji | 0.0 /100 | #330 | Tragic 95.8% |
| Immigrants | Armenia | 0.0 /100 | #331 | Tragic 95.8% |
| Immigrants | Honduras | 0.0 /100 | #332 | Tragic 95.8% |
| Immigrants | Dominican Republic | 0.0 /100 | #333 | Tragic 95.7% |
| Immigrants | Cabo Verde | 0.0 /100 | #334 | Tragic 95.7% |
| Immigrants | Latin America | 0.0 /100 | #335 | Tragic 95.7% |