Immigrants from Pakistan vs Colombian Professional Degree
COMPARE
Immigrants from Pakistan
Colombian
Professional Degree
Professional Degree Comparison
Immigrants from Pakistan
Colombians
5.0%
PROFESSIONAL DEGREE
97.2/ 100
METRIC RATING
113th/ 347
METRIC RANK
4.6%
PROFESSIONAL DEGREE
77.7/ 100
METRIC RATING
147th/ 347
METRIC RANK
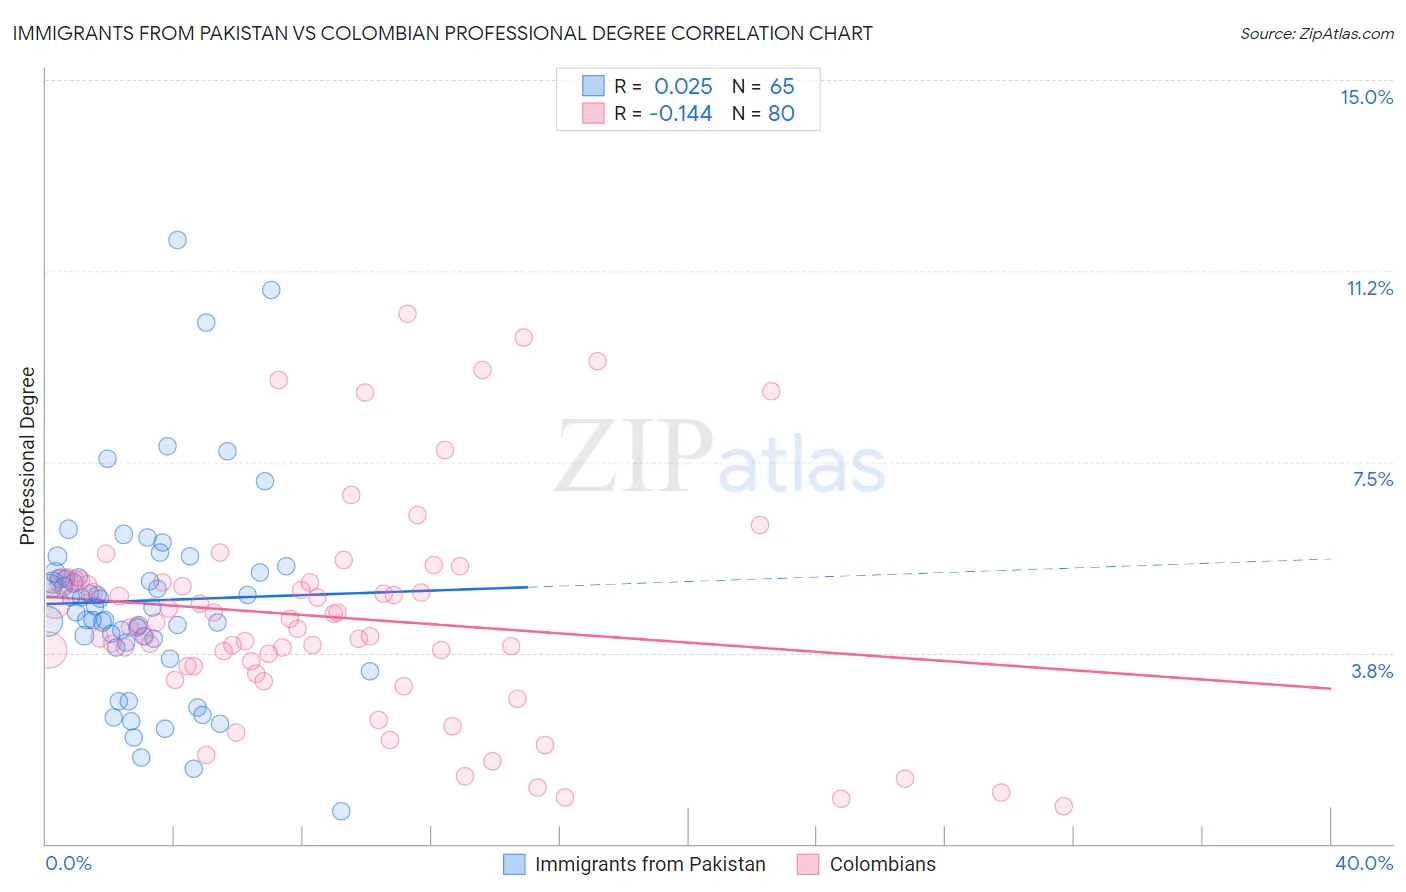
Immigrants from Pakistan vs Colombian Professional Degree Correlation Chart
The statistical analysis conducted on geographies consisting of 283,716,553 people shows no correlation between the proportion of Immigrants from Pakistan and percentage of population with at least professional degree education in the United States with a correlation coefficient (R) of 0.025 and weighted average of 5.0%. Similarly, the statistical analysis conducted on geographies consisting of 418,695,587 people shows a poor negative correlation between the proportion of Colombians and percentage of population with at least professional degree education in the United States with a correlation coefficient (R) of -0.144 and weighted average of 4.6%, a difference of 8.1%.
Professional Degree Correlation Summary
| Measurement | Immigrants from Pakistan | Colombian |
| Minimum | 0.64% | 0.74% |
| Maximum | 11.9% | 10.4% |
| Range | 11.2% | 9.7% |
| Mean | 4.8% | 4.5% |
| Median | 4.7% | 4.3% |
| Interquartile 25% (IQ1) | 4.0% | 3.5% |
| Interquartile 75% (IQ3) | 5.3% | 5.1% |
| Interquartile Range (IQR) | 1.3% | 1.7% |
| Standard Deviation (Sample) | 2.0% | 2.1% |
| Standard Deviation (Population) | 2.0% | 2.1% |
Similar Demographics by Professional Degree
Demographics Similar to Immigrants from Pakistan by Professional Degree
In terms of professional degree, the demographic groups most similar to Immigrants from Pakistan are Taiwanese (5.0%, a difference of 0.020%), Brazilian (5.0%, a difference of 0.24%), Immigrants from Morocco (5.0%, a difference of 0.45%), Moroccan (5.0%, a difference of 0.55%), and Lebanese (5.0%, a difference of 0.98%).
| Demographics | Rating | Rank | Professional Degree |
| Immigrants | Ukraine | 98.2 /100 | #106 | Exceptional 5.0% |
| Maltese | 98.1 /100 | #107 | Exceptional 5.0% |
| Immigrants | Southern Europe | 98.1 /100 | #108 | Exceptional 5.0% |
| British | 98.0 /100 | #109 | Exceptional 5.0% |
| Lebanese | 98.0 /100 | #110 | Exceptional 5.0% |
| Brazilians | 97.4 /100 | #111 | Exceptional 5.0% |
| Taiwanese | 97.3 /100 | #112 | Exceptional 5.0% |
| Immigrants | Pakistan | 97.2 /100 | #113 | Exceptional 5.0% |
| Immigrants | Morocco | 96.8 /100 | #114 | Exceptional 5.0% |
| Moroccans | 96.8 /100 | #115 | Exceptional 5.0% |
| Venezuelans | 96.3 /100 | #116 | Exceptional 4.9% |
| Immigrants | Syria | 96.0 /100 | #117 | Exceptional 4.9% |
| Croatians | 96.0 /100 | #118 | Exceptional 4.9% |
| Immigrants | Sudan | 95.4 /100 | #119 | Exceptional 4.9% |
| Albanians | 95.3 /100 | #120 | Exceptional 4.9% |
Demographics Similar to Colombians by Professional Degree
In terms of professional degree, the demographic groups most similar to Colombians are Luxembourger (4.6%, a difference of 0.21%), Slovene (4.6%, a difference of 0.32%), Senegalese (4.6%, a difference of 0.46%), Uruguayan (4.6%, a difference of 0.53%), and Immigrants from South America (4.6%, a difference of 0.58%).
| Demographics | Rating | Rank | Professional Degree |
| Canadians | 84.4 /100 | #140 | Excellent 4.7% |
| Basques | 81.8 /100 | #141 | Excellent 4.6% |
| Sudanese | 81.3 /100 | #142 | Excellent 4.6% |
| Hungarians | 80.8 /100 | #143 | Excellent 4.6% |
| Immigrants | South America | 80.5 /100 | #144 | Excellent 4.6% |
| Uruguayans | 80.2 /100 | #145 | Excellent 4.6% |
| Luxembourgers | 78.7 /100 | #146 | Good 4.6% |
| Colombians | 77.7 /100 | #147 | Good 4.6% |
| Slovenes | 76.1 /100 | #148 | Good 4.6% |
| Senegalese | 75.3 /100 | #149 | Good 4.6% |
| Immigrants | Oceania | 73.4 /100 | #150 | Good 4.6% |
| Poles | 72.6 /100 | #151 | Good 4.6% |
| Immigrants | Africa | 72.5 /100 | #152 | Good 4.6% |
| Immigrants | Uruguay | 72.5 /100 | #153 | Good 4.6% |
| Scottish | 71.8 /100 | #154 | Good 4.6% |