Cheyenne vs Immigrants from Kenya 3rd Grade
COMPARE
Cheyenne
Immigrants from Kenya
3rd Grade
3rd Grade Comparison
Cheyenne
Immigrants from Kenya
98.2%
3RD GRADE
99.3/ 100
METRIC RATING
73rd/ 347
METRIC RANK
97.7%
3RD GRADE
28.2/ 100
METRIC RATING
193rd/ 347
METRIC RANK
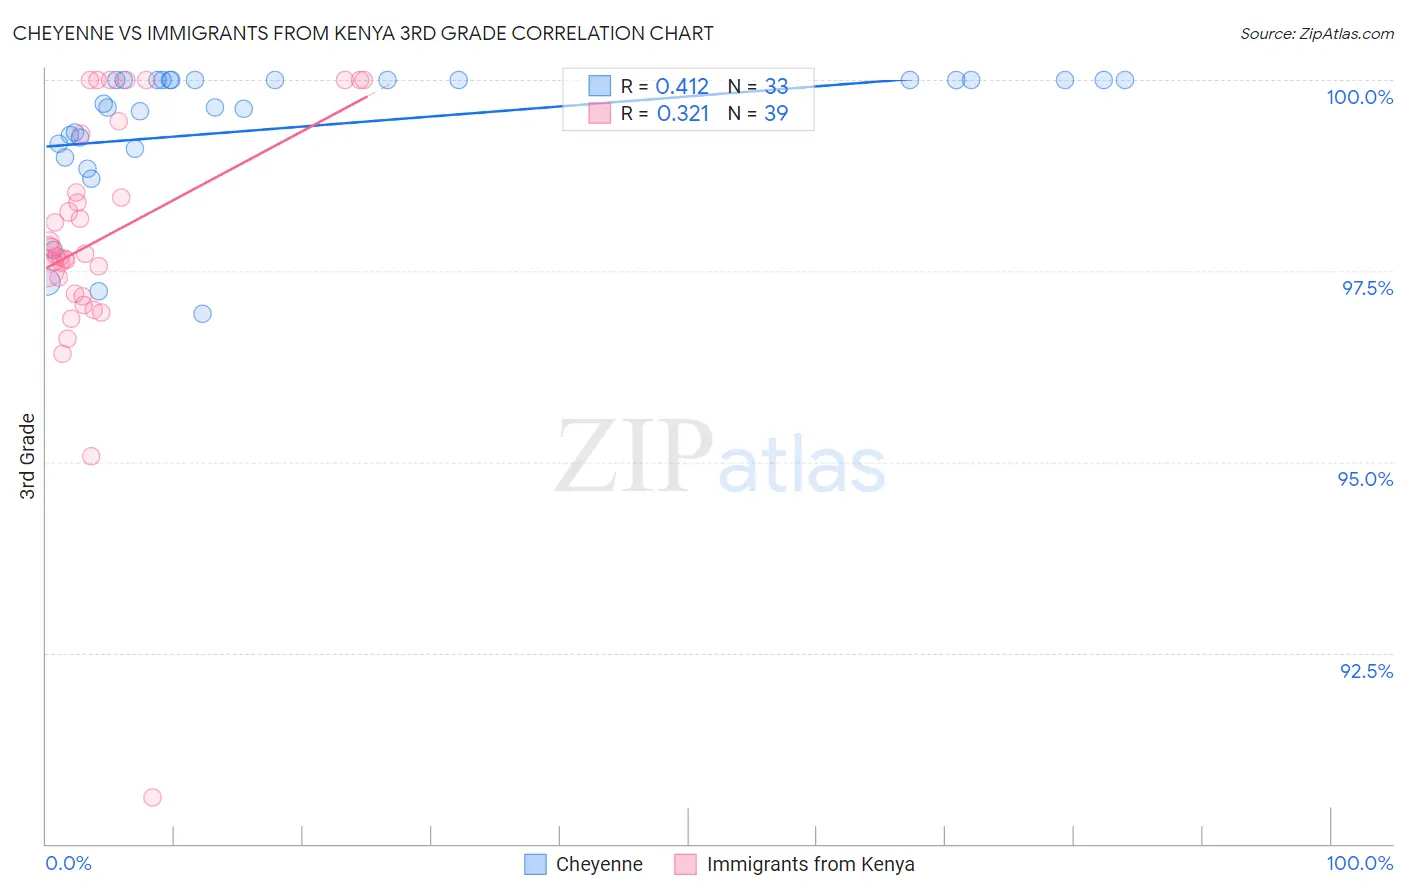
Cheyenne vs Immigrants from Kenya 3rd Grade Correlation Chart
The statistical analysis conducted on geographies consisting of 80,716,760 people shows a moderate positive correlation between the proportion of Cheyenne and percentage of population with at least 3rd grade education in the United States with a correlation coefficient (R) of 0.412 and weighted average of 98.2%. Similarly, the statistical analysis conducted on geographies consisting of 218,076,690 people shows a mild positive correlation between the proportion of Immigrants from Kenya and percentage of population with at least 3rd grade education in the United States with a correlation coefficient (R) of 0.321 and weighted average of 97.7%, a difference of 0.50%.
3rd Grade Correlation Summary
| Measurement | Cheyenne | Immigrants from Kenya |
| Minimum | 96.9% | 90.6% |
| Maximum | 100.0% | 100.0% |
| Range | 3.1% | 9.4% |
| Mean | 99.4% | 97.9% |
| Median | 99.7% | 97.7% |
| Interquartile 25% (IQ1) | 99.1% | 97.2% |
| Interquartile 75% (IQ3) | 100.0% | 99.3% |
| Interquartile Range (IQR) | 0.87% | 2.1% |
| Standard Deviation (Sample) | 0.88% | 1.7% |
| Standard Deviation (Population) | 0.87% | 1.7% |
Similar Demographics by 3rd Grade
Demographics Similar to Cheyenne by 3rd Grade
In terms of 3rd grade, the demographic groups most similar to Cheyenne are Immigrants from Netherlands (98.2%, a difference of 0.010%), Cherokee (98.2%, a difference of 0.010%), Immigrants from England (98.2%, a difference of 0.010%), Immigrants from Lithuania (98.2%, a difference of 0.020%), and Osage (98.2%, a difference of 0.020%).
| Demographics | Rating | Rank | 3rd Grade |
| Serbians | 99.6 /100 | #66 | Exceptional 98.2% |
| Russians | 99.6 /100 | #67 | Exceptional 98.2% |
| Immigrants | Northern Europe | 99.6 /100 | #68 | Exceptional 98.2% |
| Canadians | 99.6 /100 | #69 | Exceptional 98.2% |
| Cajuns | 99.6 /100 | #70 | Exceptional 98.2% |
| Immigrants | Austria | 99.6 /100 | #71 | Exceptional 98.2% |
| Chickasaw | 99.5 /100 | #72 | Exceptional 98.2% |
| Cheyenne | 99.3 /100 | #73 | Exceptional 98.2% |
| Immigrants | Netherlands | 99.3 /100 | #74 | Exceptional 98.2% |
| Cherokee | 99.3 /100 | #75 | Exceptional 98.2% |
| Immigrants | England | 99.2 /100 | #76 | Exceptional 98.2% |
| Immigrants | Lithuania | 99.2 /100 | #77 | Exceptional 98.2% |
| Osage | 99.2 /100 | #78 | Exceptional 98.2% |
| Immigrants | Belgium | 99.1 /100 | #79 | Exceptional 98.1% |
| Macedonians | 99.1 /100 | #80 | Exceptional 98.1% |
Demographics Similar to Immigrants from Kenya by 3rd Grade
In terms of 3rd grade, the demographic groups most similar to Immigrants from Kenya are Mongolian (97.7%, a difference of 0.0%), Immigrants from Uganda (97.7%, a difference of 0.0%), Panamanian (97.7%, a difference of 0.010%), Black/African American (97.7%, a difference of 0.010%), and Immigrants from Egypt (97.7%, a difference of 0.010%).
| Demographics | Rating | Rank | 3rd Grade |
| Portuguese | 36.2 /100 | #186 | Fair 97.7% |
| Natives/Alaskans | 35.2 /100 | #187 | Fair 97.7% |
| Immigrants | Taiwan | 34.2 /100 | #188 | Fair 97.7% |
| Pakistanis | 34.2 /100 | #189 | Fair 97.7% |
| Panamanians | 31.5 /100 | #190 | Fair 97.7% |
| Blacks/African Americans | 29.6 /100 | #191 | Fair 97.7% |
| Mongolians | 29.1 /100 | #192 | Fair 97.7% |
| Immigrants | Kenya | 28.2 /100 | #193 | Fair 97.7% |
| Immigrants | Uganda | 27.4 /100 | #194 | Fair 97.7% |
| Immigrants | Egypt | 26.8 /100 | #195 | Fair 97.7% |
| Paraguayans | 26.2 /100 | #196 | Fair 97.7% |
| Hawaiians | 25.7 /100 | #197 | Fair 97.7% |
| Guamanians/Chamorros | 23.6 /100 | #198 | Fair 97.7% |
| Immigrants | Ukraine | 22.7 /100 | #199 | Fair 97.7% |
| Immigrants | Albania | 22.6 /100 | #200 | Fair 97.7% |