Tsimshian vs Chippewa 9th Grade
COMPARE
Tsimshian
Chippewa
9th Grade
9th Grade Comparison
Tsimshian
Chippewa
97.0%
9TH GRADE
100.0/ 100
METRIC RATING
1st/ 347
METRIC RANK
96.1%
9TH GRADE
99.9/ 100
METRIC RATING
42nd/ 347
METRIC RANK
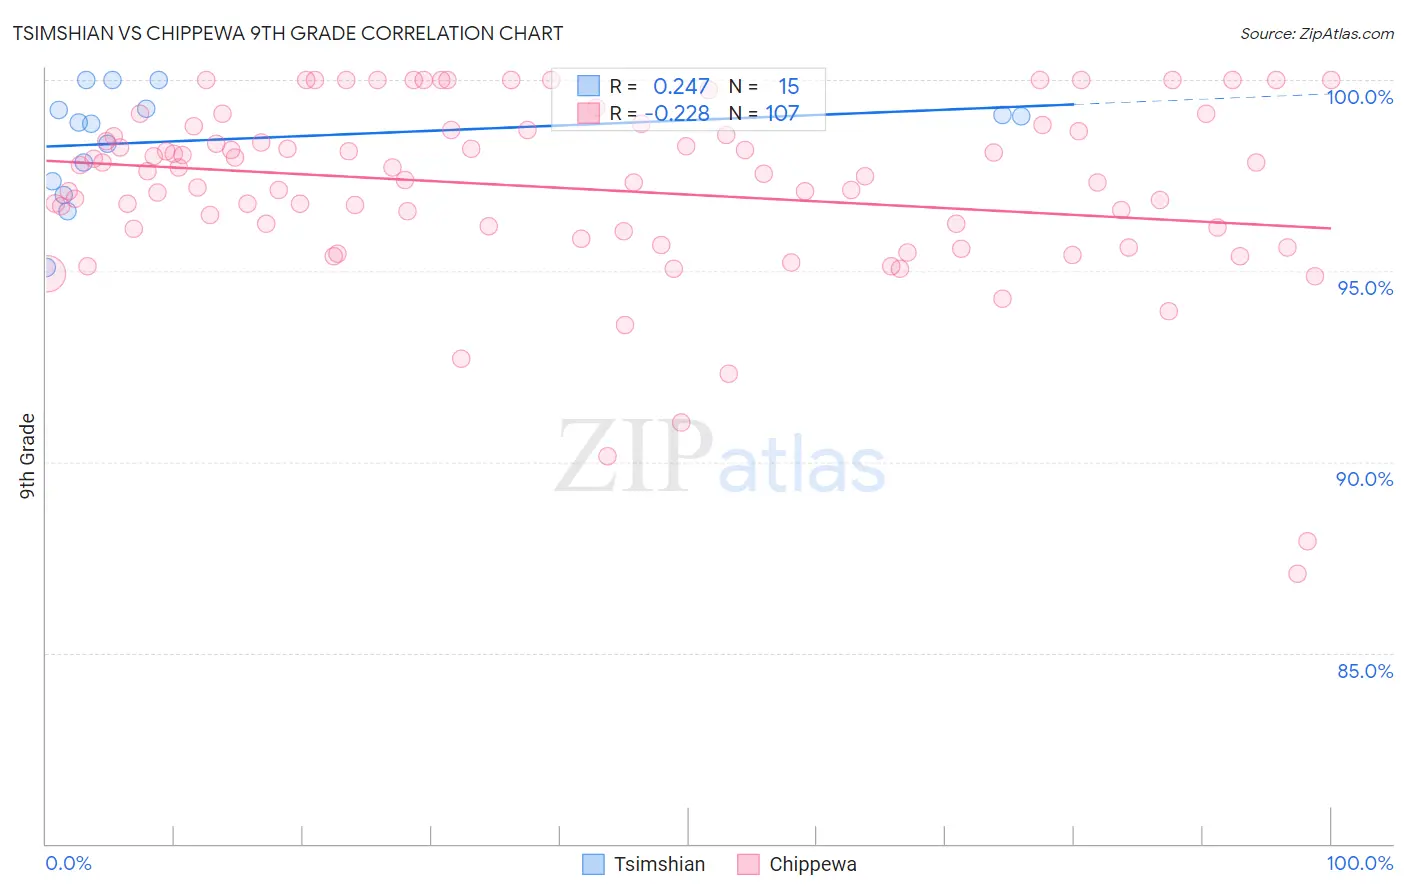
Tsimshian vs Chippewa 9th Grade Correlation Chart
The statistical analysis conducted on geographies consisting of 15,626,544 people shows a weak positive correlation between the proportion of Tsimshian and percentage of population with at least 9th grade education in the United States with a correlation coefficient (R) of 0.247 and weighted average of 97.0%. Similarly, the statistical analysis conducted on geographies consisting of 215,065,864 people shows a weak negative correlation between the proportion of Chippewa and percentage of population with at least 9th grade education in the United States with a correlation coefficient (R) of -0.228 and weighted average of 96.1%, a difference of 0.95%.
9th Grade Correlation Summary
| Measurement | Tsimshian | Chippewa |
| Minimum | 95.1% | 87.1% |
| Maximum | 100.0% | 100.0% |
| Range | 4.9% | 12.9% |
| Mean | 98.4% | 97.2% |
| Median | 98.9% | 97.5% |
| Interquartile 25% (IQ1) | 97.4% | 96.0% |
| Interquartile 75% (IQ3) | 99.2% | 98.7% |
| Interquartile Range (IQR) | 1.9% | 2.7% |
| Standard Deviation (Sample) | 1.4% | 2.4% |
| Standard Deviation (Population) | 1.4% | 2.4% |
Similar Demographics by 9th Grade
Demographics Similar to Tsimshian by 9th Grade
In terms of 9th grade, the demographic groups most similar to Tsimshian are Norwegian (96.9%, a difference of 0.090%), Slovak (96.9%, a difference of 0.14%), Slovene (96.7%, a difference of 0.27%), Swedish (96.7%, a difference of 0.28%), and Polish (96.7%, a difference of 0.29%).
| Demographics | Rating | Rank | 9th Grade |
| Tsimshian | 100.0 /100 | #1 | Exceptional 97.0% |
| Norwegians | 100.0 /100 | #2 | Exceptional 96.9% |
| Slovaks | 100.0 /100 | #3 | Exceptional 96.9% |
| Slovenes | 100.0 /100 | #4 | Exceptional 96.7% |
| Swedes | 100.0 /100 | #5 | Exceptional 96.7% |
| Poles | 100.0 /100 | #6 | Exceptional 96.7% |
| Carpatho Rusyns | 100.0 /100 | #7 | Exceptional 96.7% |
| Germans | 100.0 /100 | #8 | Exceptional 96.7% |
| Tlingit-Haida | 100.0 /100 | #9 | Exceptional 96.6% |
| Lithuanians | 100.0 /100 | #10 | Exceptional 96.6% |
| Finns | 100.0 /100 | #11 | Exceptional 96.6% |
| English | 100.0 /100 | #12 | Exceptional 96.6% |
| Danes | 100.0 /100 | #13 | Exceptional 96.5% |
| Scottish | 100.0 /100 | #14 | Exceptional 96.5% |
| Irish | 100.0 /100 | #15 | Exceptional 96.5% |
Demographics Similar to Chippewa by 9th Grade
In terms of 9th grade, the demographic groups most similar to Chippewa are Czechoslovakian (96.1%, a difference of 0.0%), Slavic (96.1%, a difference of 0.010%), Iranian (96.1%, a difference of 0.010%), Ottawa (96.1%, a difference of 0.030%), and Alaska Native (96.1%, a difference of 0.030%).
| Demographics | Rating | Rank | 9th Grade |
| Bulgarians | 99.9 /100 | #35 | Exceptional 96.2% |
| Northern Europeans | 99.9 /100 | #36 | Exceptional 96.2% |
| Estonians | 99.9 /100 | #37 | Exceptional 96.1% |
| Immigrants | Scotland | 99.9 /100 | #38 | Exceptional 96.1% |
| Ottawa | 99.9 /100 | #39 | Exceptional 96.1% |
| Slavs | 99.9 /100 | #40 | Exceptional 96.1% |
| Czechoslovakians | 99.9 /100 | #41 | Exceptional 96.1% |
| Chippewa | 99.9 /100 | #42 | Exceptional 96.1% |
| Iranians | 99.9 /100 | #43 | Exceptional 96.1% |
| Alaska Natives | 99.9 /100 | #44 | Exceptional 96.1% |
| Crow | 99.9 /100 | #45 | Exceptional 96.1% |
| Immigrants | India | 99.9 /100 | #46 | Exceptional 96.1% |
| Russians | 99.9 /100 | #47 | Exceptional 96.0% |
| Australians | 99.9 /100 | #48 | Exceptional 96.0% |
| Greeks | 99.9 /100 | #49 | Exceptional 96.0% |