Cherokee vs Slovak Doctorate Degree
COMPARE
Cherokee
Slovak
Doctorate Degree
Doctorate Degree Comparison
Cherokee
Slovaks
1.5%
DOCTORATE DEGREE
0.3/ 100
METRIC RATING
286th/ 347
METRIC RANK
1.8%
DOCTORATE DEGREE
36.4/ 100
METRIC RATING
185th/ 347
METRIC RANK
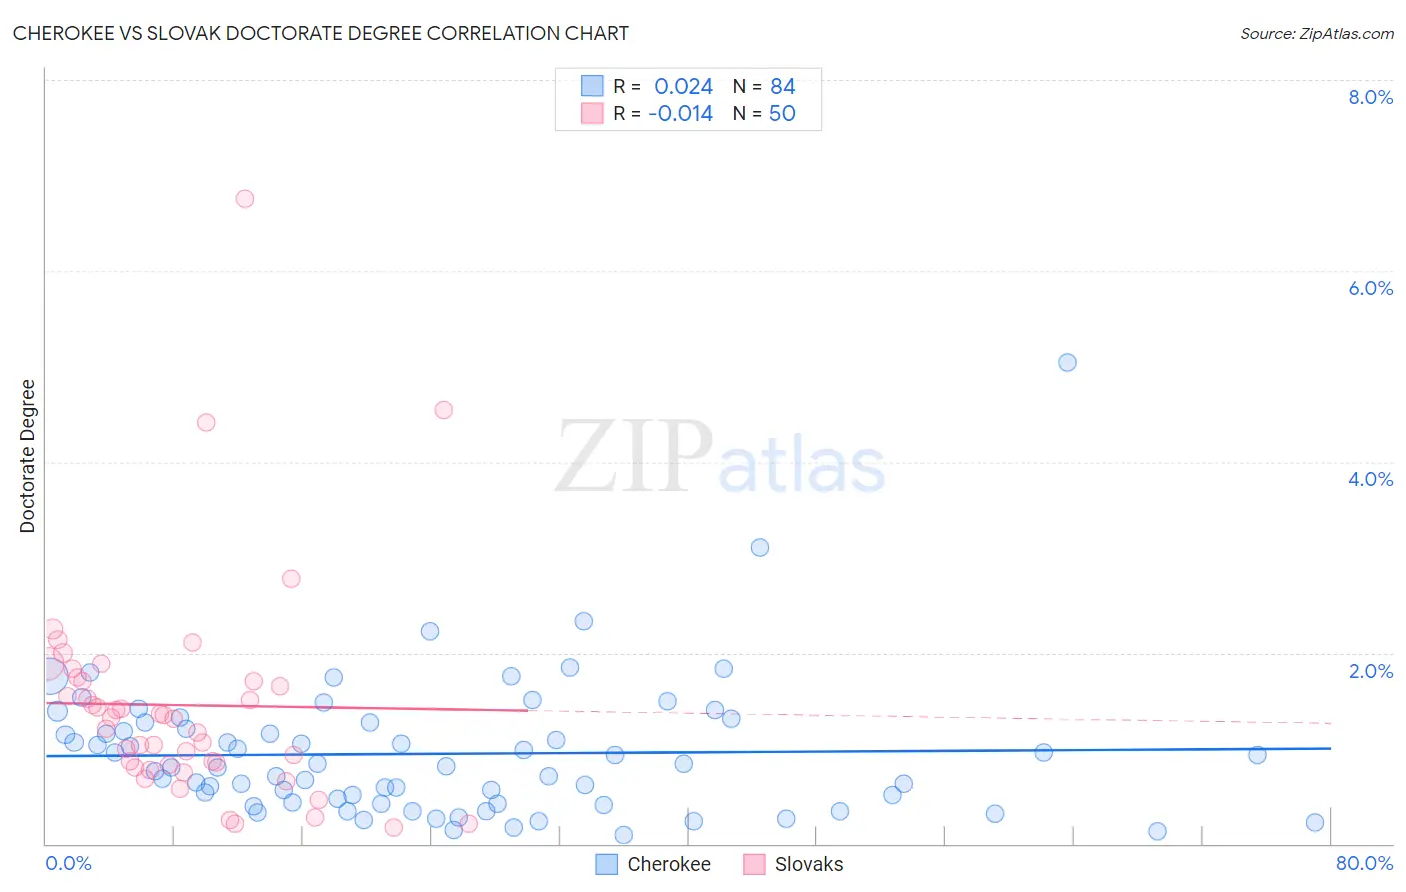
Cherokee vs Slovak Doctorate Degree Correlation Chart
The statistical analysis conducted on geographies consisting of 478,818,263 people shows no correlation between the proportion of Cherokee and percentage of population with at least doctorate degree education in the United States with a correlation coefficient (R) of 0.024 and weighted average of 1.5%. Similarly, the statistical analysis conducted on geographies consisting of 392,855,228 people shows no correlation between the proportion of Slovaks and percentage of population with at least doctorate degree education in the United States with a correlation coefficient (R) of -0.014 and weighted average of 1.8%, a difference of 23.9%.
Doctorate Degree Correlation Summary
| Measurement | Cherokee | Slovak |
| Minimum | 0.091% | 0.17% |
| Maximum | 5.0% | 6.8% |
| Range | 5.0% | 6.6% |
| Mean | 0.94% | 1.5% |
| Median | 0.81% | 1.3% |
| Interquartile 25% (IQ1) | 0.43% | 0.83% |
| Interquartile 75% (IQ3) | 1.2% | 1.7% |
| Interquartile Range (IQR) | 0.81% | 0.88% |
| Standard Deviation (Sample) | 0.73% | 1.2% |
| Standard Deviation (Population) | 0.72% | 1.1% |
Similar Demographics by Doctorate Degree
Demographics Similar to Cherokee by Doctorate Degree
In terms of doctorate degree, the demographic groups most similar to Cherokee are Cajun (1.5%, a difference of 0.17%), Malaysian (1.5%, a difference of 0.18%), Jamaican (1.5%, a difference of 0.21%), Central American (1.5%, a difference of 0.24%), and British West Indian (1.5%, a difference of 0.29%).
| Demographics | Rating | Rank | Doctorate Degree |
| Marshallese | 0.4 /100 | #279 | Tragic 1.5% |
| Ecuadorians | 0.4 /100 | #280 | Tragic 1.5% |
| Tohono O'odham | 0.4 /100 | #281 | Tragic 1.5% |
| British West Indians | 0.3 /100 | #282 | Tragic 1.5% |
| Central Americans | 0.3 /100 | #283 | Tragic 1.5% |
| Jamaicans | 0.3 /100 | #284 | Tragic 1.5% |
| Malaysians | 0.3 /100 | #285 | Tragic 1.5% |
| Cherokee | 0.3 /100 | #286 | Tragic 1.5% |
| Cajuns | 0.3 /100 | #287 | Tragic 1.5% |
| Immigrants | El Salvador | 0.3 /100 | #288 | Tragic 1.4% |
| Cape Verdeans | 0.3 /100 | #289 | Tragic 1.4% |
| Choctaw | 0.3 /100 | #290 | Tragic 1.4% |
| Blacks/African Americans | 0.3 /100 | #291 | Tragic 1.4% |
| Alaska Natives | 0.3 /100 | #292 | Tragic 1.4% |
| Immigrants | Yemen | 0.2 /100 | #293 | Tragic 1.4% |
Demographics Similar to Slovaks by Doctorate Degree
In terms of doctorate degree, the demographic groups most similar to Slovaks are Peruvian (1.8%, a difference of 0.32%), Czechoslovakian (1.8%, a difference of 0.55%), Nigerian (1.8%, a difference of 0.57%), Finnish (1.8%, a difference of 0.90%), and German (1.8%, a difference of 1.0%).
| Demographics | Rating | Rank | Doctorate Degree |
| French | 48.8 /100 | #178 | Average 1.8% |
| Ghanaians | 48.3 /100 | #179 | Average 1.8% |
| Scandinavians | 48.0 /100 | #180 | Average 1.8% |
| Immigrants | Immigrants | 46.2 /100 | #181 | Average 1.8% |
| Immigrants | Afghanistan | 44.3 /100 | #182 | Average 1.8% |
| Finns | 42.1 /100 | #183 | Average 1.8% |
| Nigerians | 39.9 /100 | #184 | Fair 1.8% |
| Slovaks | 36.4 /100 | #185 | Fair 1.8% |
| Peruvians | 34.4 /100 | #186 | Fair 1.8% |
| Czechoslovakians | 33.0 /100 | #187 | Fair 1.8% |
| Germans | 30.5 /100 | #188 | Fair 1.8% |
| French Canadians | 30.2 /100 | #189 | Fair 1.8% |
| Immigrants | Costa Rica | 30.2 /100 | #190 | Fair 1.8% |
| South Americans | 29.5 /100 | #191 | Fair 1.8% |
| Dutch | 27.4 /100 | #192 | Fair 1.8% |