Central American vs Bolivian 2nd Grade
COMPARE
Central American
Bolivian
2nd Grade
2nd Grade Comparison
Central Americans
Bolivians
96.4%
2ND GRADE
0.0/ 100
METRIC RATING
334th/ 347
METRIC RANK
97.5%
2ND GRADE
0.9/ 100
METRIC RATING
249th/ 347
METRIC RANK
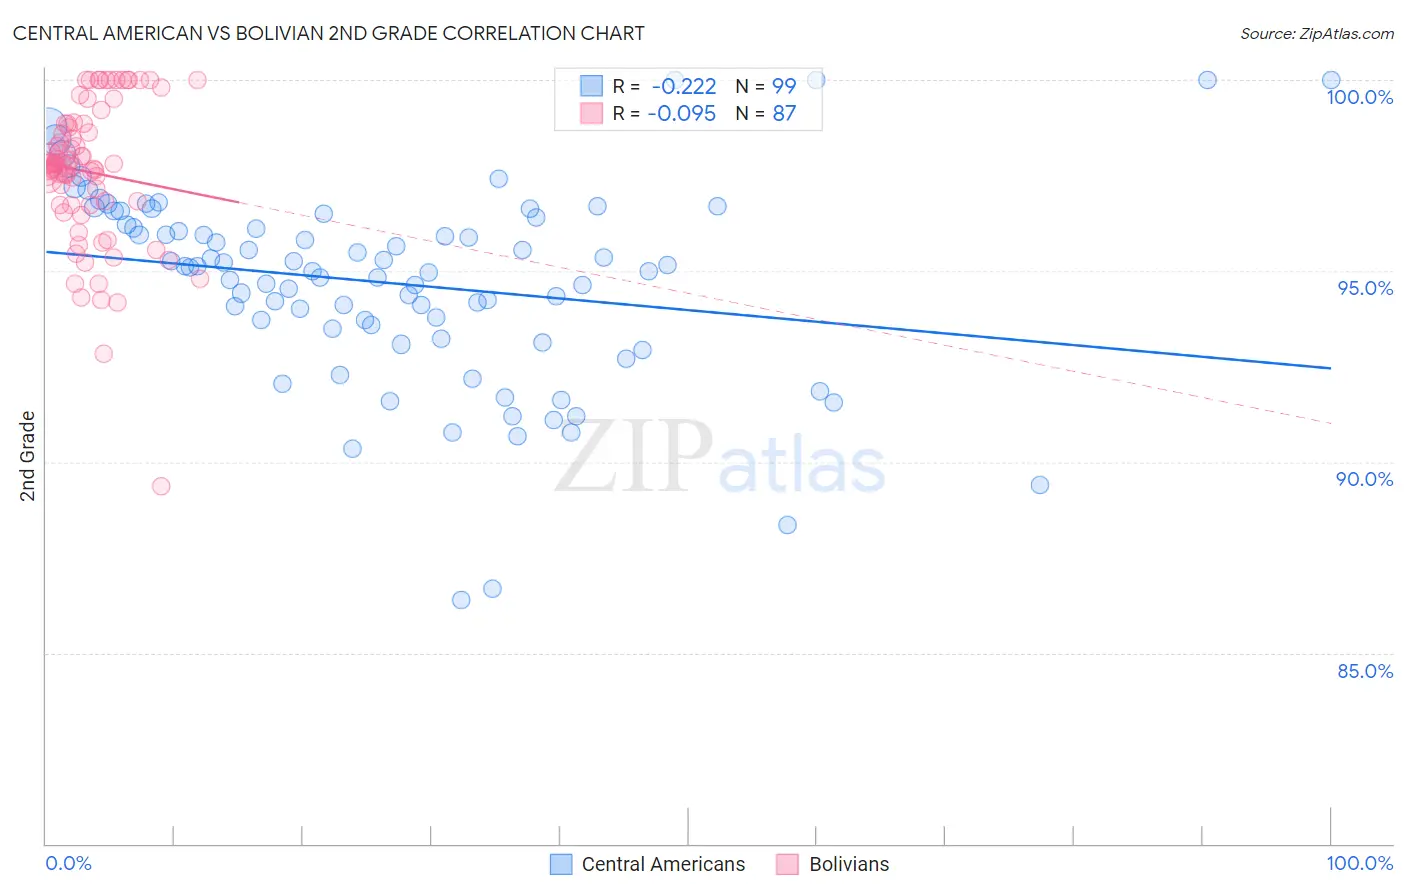
Central American vs Bolivian 2nd Grade Correlation Chart
The statistical analysis conducted on geographies consisting of 504,619,275 people shows a weak negative correlation between the proportion of Central Americans and percentage of population with at least 2nd grade education in the United States with a correlation coefficient (R) of -0.222 and weighted average of 96.4%. Similarly, the statistical analysis conducted on geographies consisting of 184,667,361 people shows a slight negative correlation between the proportion of Bolivians and percentage of population with at least 2nd grade education in the United States with a correlation coefficient (R) of -0.095 and weighted average of 97.5%, a difference of 1.2%.
2nd Grade Correlation Summary
| Measurement | Central American | Bolivian |
| Minimum | 86.4% | 89.3% |
| Maximum | 100.0% | 100.0% |
| Range | 13.6% | 10.7% |
| Mean | 94.7% | 97.6% |
| Median | 95.1% | 97.8% |
| Interquartile 25% (IQ1) | 93.5% | 96.7% |
| Interquartile 75% (IQ3) | 96.4% | 98.8% |
| Interquartile Range (IQR) | 2.9% | 2.1% |
| Standard Deviation (Sample) | 2.6% | 1.9% |
| Standard Deviation (Population) | 2.6% | 1.9% |
Similar Demographics by 2nd Grade
Demographics Similar to Central Americans by 2nd Grade
In terms of 2nd grade, the demographic groups most similar to Central Americans are Yakama (96.4%, a difference of 0.010%), Immigrants from Dominican Republic (96.4%, a difference of 0.020%), Immigrants from Fiji (96.4%, a difference of 0.020%), Immigrants from Cambodia (96.4%, a difference of 0.030%), and Immigrants from Cabo Verde (96.3%, a difference of 0.050%).
| Demographics | Rating | Rank | 2nd Grade |
| Immigrants | Vietnam | 0.0 /100 | #327 | Tragic 96.5% |
| Mexicans | 0.0 /100 | #328 | Tragic 96.5% |
| Japanese | 0.0 /100 | #329 | Tragic 96.5% |
| Immigrants | Latin America | 0.0 /100 | #330 | Tragic 96.5% |
| Immigrants | Armenia | 0.0 /100 | #331 | Tragic 96.5% |
| Bangladeshis | 0.0 /100 | #332 | Tragic 96.5% |
| Immigrants | Dominican Republic | 0.0 /100 | #333 | Tragic 96.4% |
| Central Americans | 0.0 /100 | #334 | Tragic 96.4% |
| Yakama | 0.0 /100 | #335 | Tragic 96.4% |
| Immigrants | Fiji | 0.0 /100 | #336 | Tragic 96.4% |
| Immigrants | Cambodia | 0.0 /100 | #337 | Tragic 96.4% |
| Immigrants | Cabo Verde | 0.0 /100 | #338 | Tragic 96.3% |
| Guatemalans | 0.0 /100 | #339 | Tragic 96.3% |
| Immigrants | Guatemala | 0.0 /100 | #340 | Tragic 96.2% |
| Immigrants | Central America | 0.0 /100 | #341 | Tragic 96.2% |
Demographics Similar to Bolivians by 2nd Grade
In terms of 2nd grade, the demographic groups most similar to Bolivians are South American (97.5%, a difference of 0.0%), Immigrants from Senegal (97.5%, a difference of 0.0%), Immigrants from Middle Africa (97.5%, a difference of 0.0%), Peruvian (97.5%, a difference of 0.0%), and Immigrants from Iraq (97.5%, a difference of 0.010%).
| Demographics | Rating | Rank | 2nd Grade |
| Immigrants | Indonesia | 1.2 /100 | #242 | Tragic 97.5% |
| Asians | 1.1 /100 | #243 | Tragic 97.5% |
| Immigrants | Iraq | 1.0 /100 | #244 | Tragic 97.5% |
| Immigrants | Eastern Africa | 0.9 /100 | #245 | Tragic 97.5% |
| South Americans | 0.9 /100 | #246 | Tragic 97.5% |
| Immigrants | Senegal | 0.9 /100 | #247 | Tragic 97.5% |
| Immigrants | Middle Africa | 0.9 /100 | #248 | Tragic 97.5% |
| Bolivians | 0.9 /100 | #249 | Tragic 97.5% |
| Peruvians | 0.9 /100 | #250 | Tragic 97.5% |
| Immigrants | Africa | 0.8 /100 | #251 | Tragic 97.5% |
| Immigrants | Asia | 0.7 /100 | #252 | Tragic 97.5% |
| Puerto Ricans | 0.7 /100 | #253 | Tragic 97.5% |
| Indians (Asian) | 0.6 /100 | #254 | Tragic 97.5% |
| Immigrants | Congo | 0.6 /100 | #255 | Tragic 97.5% |
| Jamaicans | 0.6 /100 | #256 | Tragic 97.5% |