Central American vs Yaqui Associate's Degree
COMPARE
Central American
Yaqui
Associate's Degree
Associate's Degree Comparison
Central Americans
Yaqui
39.4%
ASSOCIATE'S DEGREE
0.0/ 100
METRIC RATING
289th/ 347
METRIC RANK
37.6%
ASSOCIATE'S DEGREE
0.0/ 100
METRIC RATING
317th/ 347
METRIC RANK
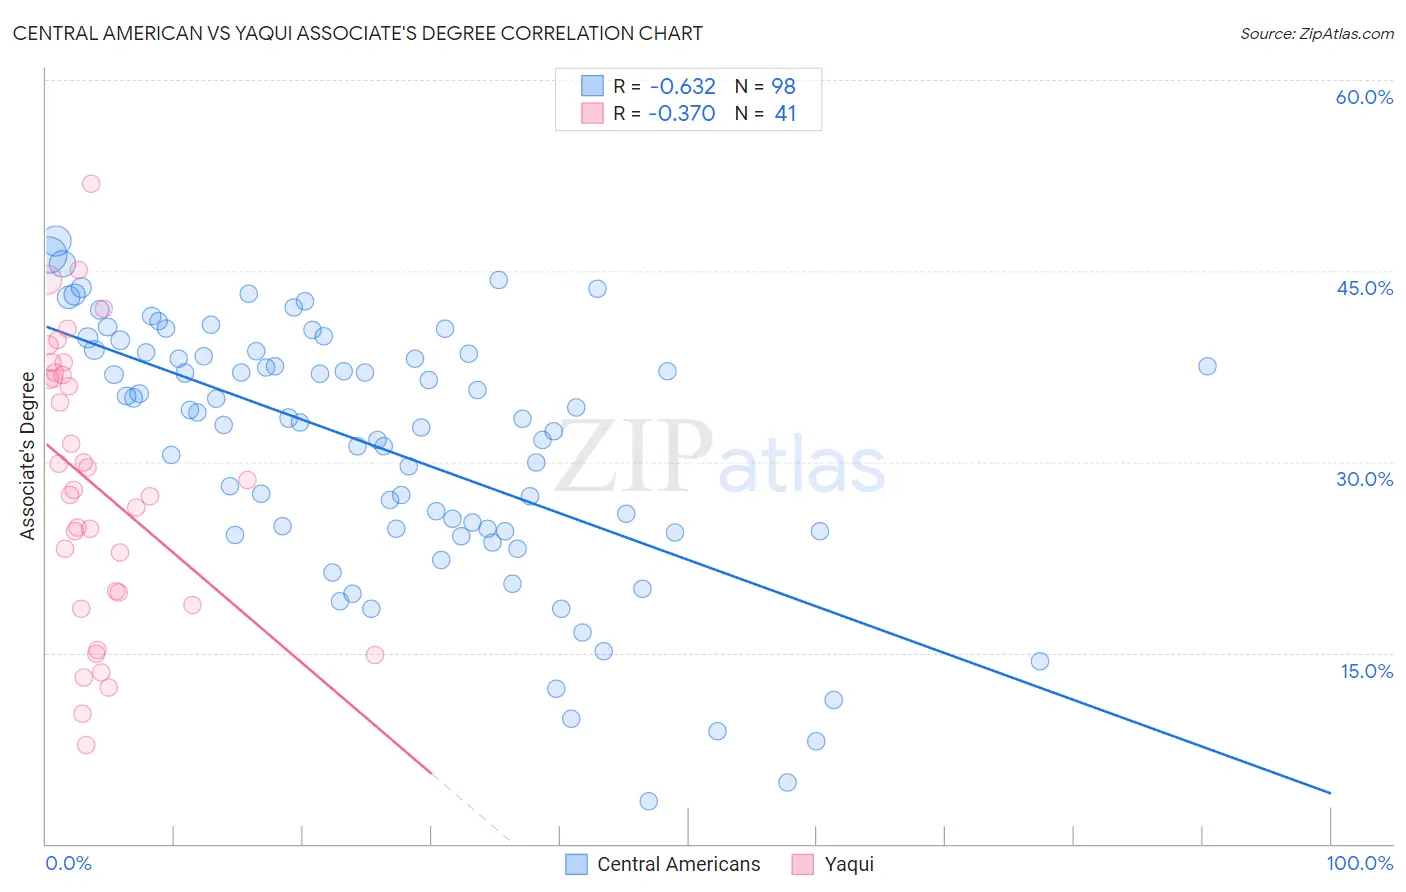
Central American vs Yaqui Associate's Degree Correlation Chart
The statistical analysis conducted on geographies consisting of 504,559,402 people shows a significant negative correlation between the proportion of Central Americans and percentage of population with at least associate's degree education in the United States with a correlation coefficient (R) of -0.632 and weighted average of 39.4%. Similarly, the statistical analysis conducted on geographies consisting of 107,738,640 people shows a mild negative correlation between the proportion of Yaqui and percentage of population with at least associate's degree education in the United States with a correlation coefficient (R) of -0.370 and weighted average of 37.6%, a difference of 5.0%.
Associate's Degree Correlation Summary
| Measurement | Central American | Yaqui |
| Minimum | 3.3% | 7.7% |
| Maximum | 47.4% | 51.9% |
| Range | 44.0% | 44.1% |
| Mean | 31.1% | 28.1% |
| Median | 33.4% | 27.8% |
| Interquartile 25% (IQ1) | 24.6% | 19.2% |
| Interquartile 75% (IQ3) | 38.6% | 36.9% |
| Interquartile Range (IQR) | 14.0% | 17.7% |
| Standard Deviation (Sample) | 10.1% | 10.8% |
| Standard Deviation (Population) | 10.0% | 10.7% |
Similar Demographics by Associate's Degree
Demographics Similar to Central Americans by Associate's Degree
In terms of associate's degree, the demographic groups most similar to Central Americans are Immigrants from Cuba (39.5%, a difference of 0.26%), Immigrants from Haiti (39.3%, a difference of 0.44%), Dominican (39.3%, a difference of 0.46%), Aleut (39.6%, a difference of 0.50%), and Black/African American (39.1%, a difference of 0.75%).
| Demographics | Rating | Rank | Associate's Degree |
| Bangladeshis | 0.1 /100 | #282 | Tragic 40.0% |
| Haitians | 0.1 /100 | #283 | Tragic 40.0% |
| Comanche | 0.1 /100 | #284 | Tragic 39.9% |
| Immigrants | Belize | 0.1 /100 | #285 | Tragic 39.9% |
| Immigrants | Caribbean | 0.0 /100 | #286 | Tragic 39.7% |
| Aleuts | 0.0 /100 | #287 | Tragic 39.6% |
| Immigrants | Cuba | 0.0 /100 | #288 | Tragic 39.5% |
| Central Americans | 0.0 /100 | #289 | Tragic 39.4% |
| Immigrants | Haiti | 0.0 /100 | #290 | Tragic 39.3% |
| Dominicans | 0.0 /100 | #291 | Tragic 39.3% |
| Blacks/African Americans | 0.0 /100 | #292 | Tragic 39.1% |
| Nepalese | 0.0 /100 | #293 | Tragic 39.0% |
| Salvadorans | 0.0 /100 | #294 | Tragic 39.0% |
| Hondurans | 0.0 /100 | #295 | Tragic 38.9% |
| Cherokee | 0.0 /100 | #296 | Tragic 38.9% |
Demographics Similar to Yaqui by Associate's Degree
In terms of associate's degree, the demographic groups most similar to Yaqui are Creek (37.6%, a difference of 0.020%), Crow (37.6%, a difference of 0.020%), Alaska Native (37.5%, a difference of 0.23%), Seminole (37.7%, a difference of 0.41%), and Fijian (37.4%, a difference of 0.45%).
| Demographics | Rating | Rank | Associate's Degree |
| Immigrants | Dominican Republic | 0.0 /100 | #310 | Tragic 37.9% |
| Immigrants | Latin America | 0.0 /100 | #311 | Tragic 37.9% |
| Choctaw | 0.0 /100 | #312 | Tragic 37.8% |
| Hispanics or Latinos | 0.0 /100 | #313 | Tragic 37.7% |
| Seminole | 0.0 /100 | #314 | Tragic 37.7% |
| Creek | 0.0 /100 | #315 | Tragic 37.6% |
| Crow | 0.0 /100 | #316 | Tragic 37.6% |
| Yaqui | 0.0 /100 | #317 | Tragic 37.6% |
| Alaska Natives | 0.0 /100 | #318 | Tragic 37.5% |
| Fijians | 0.0 /100 | #319 | Tragic 37.4% |
| Cajuns | 0.0 /100 | #320 | Tragic 37.4% |
| Immigrants | Yemen | 0.0 /100 | #321 | Tragic 37.3% |
| Pennsylvania Germans | 0.0 /100 | #322 | Tragic 37.2% |
| Immigrants | Cabo Verde | 0.0 /100 | #323 | Tragic 36.8% |
| Arapaho | 0.0 /100 | #324 | Tragic 36.7% |