Central American vs Central American Indian 5th Grade
COMPARE
Central American
Central American Indian
5th Grade
5th Grade Comparison
Central Americans
Central American Indians
95.1%
5TH GRADE
0.0/ 100
METRIC RATING
337th/ 347
METRIC RANK
95.7%
5TH GRADE
0.0/ 100
METRIC RATING
320th/ 347
METRIC RANK
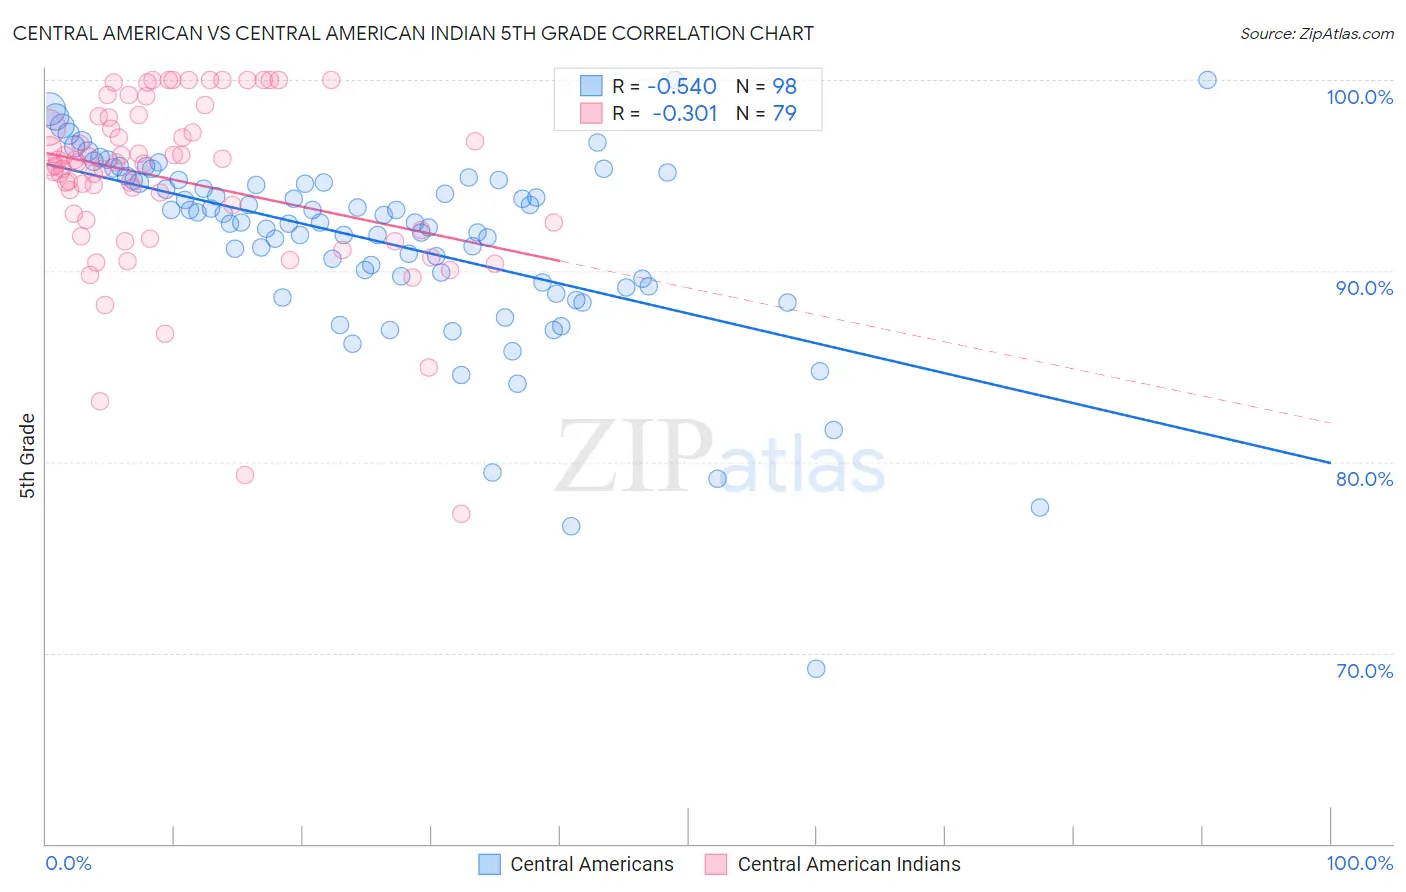
Central American vs Central American Indian 5th Grade Correlation Chart
The statistical analysis conducted on geographies consisting of 504,619,198 people shows a substantial negative correlation between the proportion of Central Americans and percentage of population with at least 5th grade education in the United States with a correlation coefficient (R) of -0.540 and weighted average of 95.1%. Similarly, the statistical analysis conducted on geographies consisting of 326,142,721 people shows a mild negative correlation between the proportion of Central American Indians and percentage of population with at least 5th grade education in the United States with a correlation coefficient (R) of -0.301 and weighted average of 95.7%, a difference of 0.71%.
5th Grade Correlation Summary
| Measurement | Central American | Central American Indian |
| Minimum | 69.2% | 77.3% |
| Maximum | 100.0% | 100.0% |
| Range | 30.8% | 22.7% |
| Mean | 91.5% | 94.7% |
| Median | 92.6% | 95.6% |
| Interquartile 25% (IQ1) | 89.4% | 92.2% |
| Interquartile 75% (IQ3) | 94.7% | 98.1% |
| Interquartile Range (IQR) | 5.3% | 5.9% |
| Standard Deviation (Sample) | 5.0% | 4.6% |
| Standard Deviation (Population) | 5.0% | 4.6% |
Demographics Similar to Central Americans and Central American Indians by 5th Grade
In terms of 5th grade, the demographic groups most similar to Central Americans are Immigrants from the Azores (95.1%, a difference of 0.070%), Immigrants from Cabo Verde (94.9%, a difference of 0.16%), Mexican (95.2%, a difference of 0.17%), Nepalese (95.2%, a difference of 0.19%), and Immigrants from Latin America (95.3%, a difference of 0.22%). Similarly, the demographic groups most similar to Central American Indians are Japanese (95.7%, a difference of 0.0%), Immigrants from Vietnam (95.8%, a difference of 0.050%), Immigrants from Belize (95.7%, a difference of 0.080%), Immigrants from Nicaragua (95.6%, a difference of 0.090%), and Immigrants from Fiji (95.6%, a difference of 0.14%).
| Demographics | Rating | Rank | 5th Grade |
| Immigrants | Vietnam | 0.0 /100 | #318 | Tragic 95.8% |
| Japanese | 0.0 /100 | #319 | Tragic 95.7% |
| Central American Indians | 0.0 /100 | #320 | Tragic 95.7% |
| Immigrants | Belize | 0.0 /100 | #321 | Tragic 95.7% |
| Immigrants | Nicaragua | 0.0 /100 | #322 | Tragic 95.6% |
| Immigrants | Fiji | 0.0 /100 | #323 | Tragic 95.6% |
| Hondurans | 0.0 /100 | #324 | Tragic 95.6% |
| Hispanics or Latinos | 0.0 /100 | #325 | Tragic 95.6% |
| Immigrants | Cambodia | 0.0 /100 | #326 | Tragic 95.5% |
| Dominicans | 0.0 /100 | #327 | Tragic 95.5% |
| Cape Verdeans | 0.0 /100 | #328 | Tragic 95.5% |
| Mexican American Indians | 0.0 /100 | #329 | Tragic 95.5% |
| Immigrants | Armenia | 0.0 /100 | #330 | Tragic 95.4% |
| Immigrants | Honduras | 0.0 /100 | #331 | Tragic 95.4% |
| Immigrants | Dominican Republic | 0.0 /100 | #332 | Tragic 95.3% |
| Immigrants | Latin America | 0.0 /100 | #333 | Tragic 95.3% |
| Nepalese | 0.0 /100 | #334 | Tragic 95.2% |
| Mexicans | 0.0 /100 | #335 | Tragic 95.2% |
| Immigrants | Azores | 0.0 /100 | #336 | Tragic 95.1% |
| Central Americans | 0.0 /100 | #337 | Tragic 95.1% |
| Immigrants | Cabo Verde | 0.0 /100 | #338 | Tragic 94.9% |