Central American vs Argentinean Doctorate Degree
COMPARE
Central American
Argentinean
Doctorate Degree
Doctorate Degree Comparison
Central Americans
Argentineans
1.5%
DOCTORATE DEGREE
0.3/ 100
METRIC RATING
283rd/ 347
METRIC RANK
2.3%
DOCTORATE DEGREE
99.9/ 100
METRIC RATING
66th/ 347
METRIC RANK
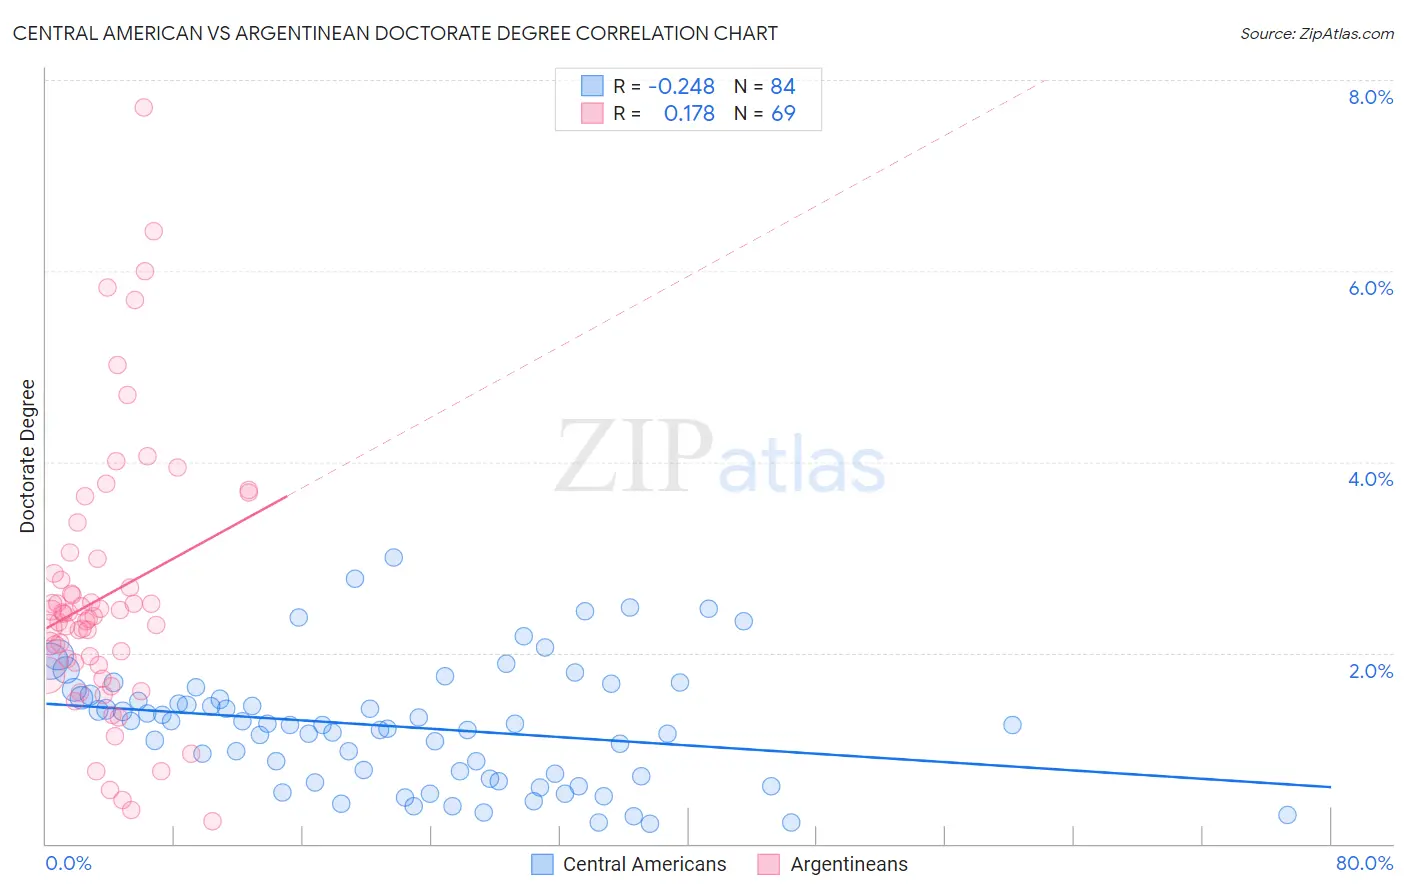
Central American vs Argentinean Doctorate Degree Correlation Chart
The statistical analysis conducted on geographies consisting of 493,729,899 people shows a weak negative correlation between the proportion of Central Americans and percentage of population with at least doctorate degree education in the United States with a correlation coefficient (R) of -0.248 and weighted average of 1.5%. Similarly, the statistical analysis conducted on geographies consisting of 296,190,369 people shows a poor positive correlation between the proportion of Argentineans and percentage of population with at least doctorate degree education in the United States with a correlation coefficient (R) of 0.178 and weighted average of 2.3%, a difference of 56.7%.
Doctorate Degree Correlation Summary
| Measurement | Central American | Argentinean |
| Minimum | 0.21% | 0.23% |
| Maximum | 3.0% | 7.7% |
| Range | 2.8% | 7.5% |
| Mean | 1.2% | 2.6% |
| Median | 1.2% | 2.4% |
| Interquartile 25% (IQ1) | 0.69% | 1.8% |
| Interquartile 75% (IQ3) | 1.5% | 2.9% |
| Interquartile Range (IQR) | 0.85% | 1.1% |
| Standard Deviation (Sample) | 0.63% | 1.4% |
| Standard Deviation (Population) | 0.63% | 1.4% |
Similar Demographics by Doctorate Degree
Demographics Similar to Central Americans by Doctorate Degree
In terms of doctorate degree, the demographic groups most similar to Central Americans are Jamaican (1.5%, a difference of 0.040%), British West Indian (1.5%, a difference of 0.050%), Malaysian (1.5%, a difference of 0.070%), Tohono O'odham (1.5%, a difference of 0.10%), and Ecuadorian (1.5%, a difference of 0.16%).
| Demographics | Rating | Rank | Doctorate Degree |
| Paiute | 0.4 /100 | #276 | Tragic 1.5% |
| Bahamians | 0.4 /100 | #277 | Tragic 1.5% |
| Hawaiians | 0.4 /100 | #278 | Tragic 1.5% |
| Marshallese | 0.4 /100 | #279 | Tragic 1.5% |
| Ecuadorians | 0.4 /100 | #280 | Tragic 1.5% |
| Tohono O'odham | 0.4 /100 | #281 | Tragic 1.5% |
| British West Indians | 0.3 /100 | #282 | Tragic 1.5% |
| Central Americans | 0.3 /100 | #283 | Tragic 1.5% |
| Jamaicans | 0.3 /100 | #284 | Tragic 1.5% |
| Malaysians | 0.3 /100 | #285 | Tragic 1.5% |
| Cherokee | 0.3 /100 | #286 | Tragic 1.5% |
| Cajuns | 0.3 /100 | #287 | Tragic 1.5% |
| Immigrants | El Salvador | 0.3 /100 | #288 | Tragic 1.4% |
| Cape Verdeans | 0.3 /100 | #289 | Tragic 1.4% |
| Choctaw | 0.3 /100 | #290 | Tragic 1.4% |
Demographics Similar to Argentineans by Doctorate Degree
In terms of doctorate degree, the demographic groups most similar to Argentineans are Paraguayan (2.3%, a difference of 0.17%), Zimbabwean (2.3%, a difference of 0.46%), Immigrants from Greece (2.3%, a difference of 0.67%), Immigrants from Kazakhstan (2.3%, a difference of 0.69%), and Carpatho Rusyn (2.3%, a difference of 0.94%).
| Demographics | Rating | Rank | Doctorate Degree |
| South Africans | 99.9 /100 | #59 | Exceptional 2.3% |
| Immigrants | Serbia | 99.9 /100 | #60 | Exceptional 2.3% |
| Bhutanese | 99.9 /100 | #61 | Exceptional 2.3% |
| Immigrants | Europe | 99.9 /100 | #62 | Exceptional 2.3% |
| Laotians | 99.9 /100 | #63 | Exceptional 2.3% |
| Immigrants | Greece | 99.9 /100 | #64 | Exceptional 2.3% |
| Paraguayans | 99.9 /100 | #65 | Exceptional 2.3% |
| Argentineans | 99.9 /100 | #66 | Exceptional 2.3% |
| Zimbabweans | 99.8 /100 | #67 | Exceptional 2.3% |
| Immigrants | Kazakhstan | 99.8 /100 | #68 | Exceptional 2.3% |
| Carpatho Rusyns | 99.8 /100 | #69 | Exceptional 2.3% |
| Lithuanians | 99.8 /100 | #70 | Exceptional 2.3% |
| Immigrants | Bolivia | 99.8 /100 | #71 | Exceptional 2.3% |
| Immigrants | Canada | 99.8 /100 | #72 | Exceptional 2.3% |
| Immigrants | Bulgaria | 99.8 /100 | #73 | Exceptional 2.3% |