Central American vs Immigrants from Mexico Doctorate Degree
COMPARE
Central American
Immigrants from Mexico
Doctorate Degree
Doctorate Degree Comparison
Central Americans
Immigrants from Mexico
1.5%
DOCTORATE DEGREE
0.3/ 100
METRIC RATING
283rd/ 347
METRIC RANK
1.1%
DOCTORATE DEGREE
0.0/ 100
METRIC RATING
344th/ 347
METRIC RANK
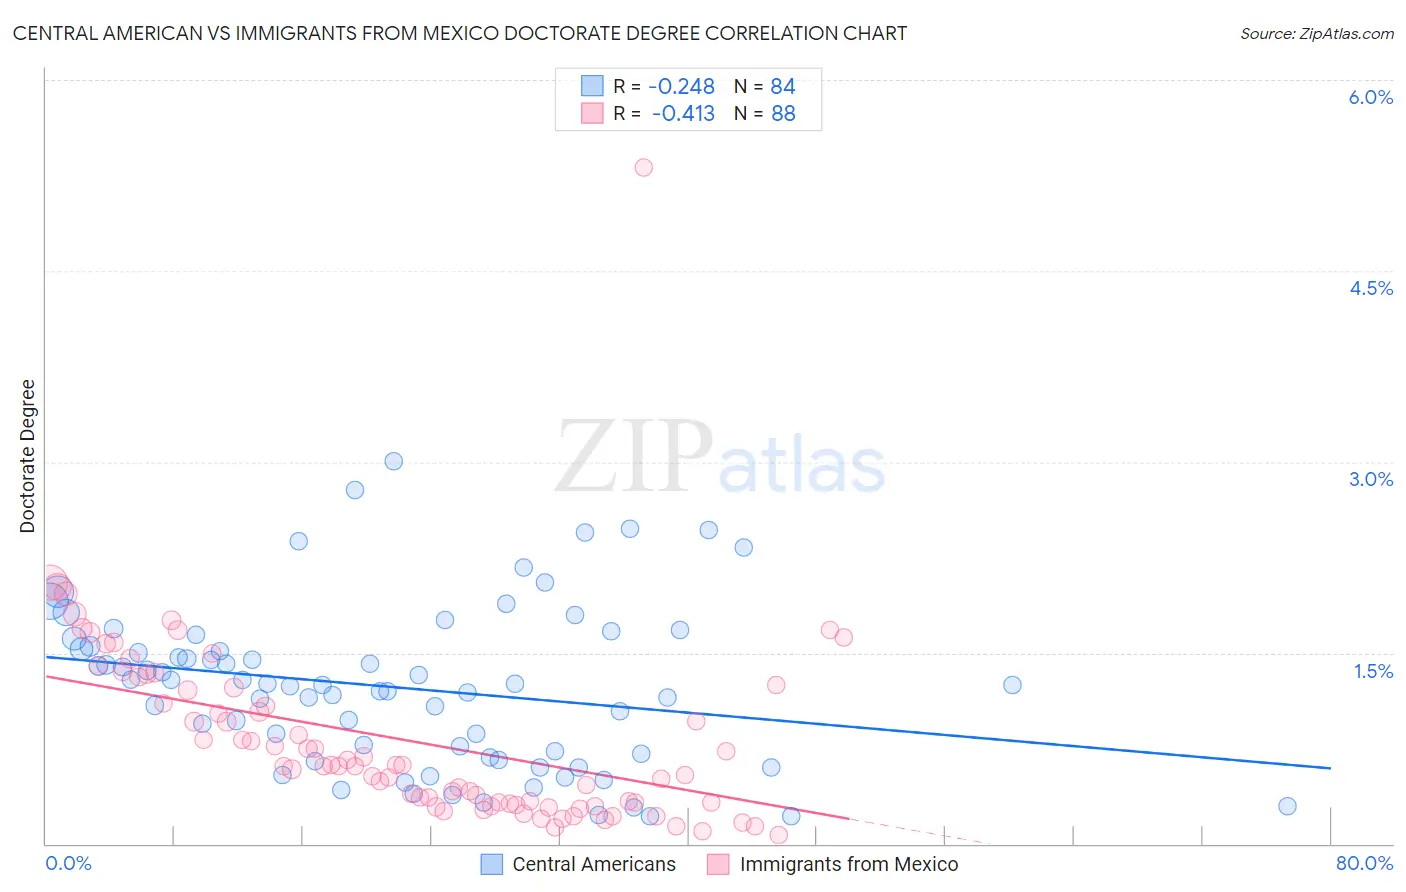
Central American vs Immigrants from Mexico Doctorate Degree Correlation Chart
The statistical analysis conducted on geographies consisting of 493,729,899 people shows a weak negative correlation between the proportion of Central Americans and percentage of population with at least doctorate degree education in the United States with a correlation coefficient (R) of -0.248 and weighted average of 1.5%. Similarly, the statistical analysis conducted on geographies consisting of 497,630,711 people shows a moderate negative correlation between the proportion of Immigrants from Mexico and percentage of population with at least doctorate degree education in the United States with a correlation coefficient (R) of -0.413 and weighted average of 1.1%, a difference of 31.8%.
Doctorate Degree Correlation Summary
| Measurement | Central American | Immigrants from Mexico |
| Minimum | 0.21% | 0.070% |
| Maximum | 3.0% | 5.3% |
| Range | 2.8% | 5.2% |
| Mean | 1.2% | 0.81% |
| Median | 1.2% | 0.61% |
| Interquartile 25% (IQ1) | 0.69% | 0.32% |
| Interquartile 75% (IQ3) | 1.5% | 1.2% |
| Interquartile Range (IQR) | 0.85% | 0.90% |
| Standard Deviation (Sample) | 0.63% | 0.72% |
| Standard Deviation (Population) | 0.63% | 0.72% |
Similar Demographics by Doctorate Degree
Demographics Similar to Central Americans by Doctorate Degree
In terms of doctorate degree, the demographic groups most similar to Central Americans are Jamaican (1.5%, a difference of 0.040%), British West Indian (1.5%, a difference of 0.050%), Malaysian (1.5%, a difference of 0.070%), Tohono O'odham (1.5%, a difference of 0.10%), and Ecuadorian (1.5%, a difference of 0.16%).
| Demographics | Rating | Rank | Doctorate Degree |
| Paiute | 0.4 /100 | #276 | Tragic 1.5% |
| Bahamians | 0.4 /100 | #277 | Tragic 1.5% |
| Hawaiians | 0.4 /100 | #278 | Tragic 1.5% |
| Marshallese | 0.4 /100 | #279 | Tragic 1.5% |
| Ecuadorians | 0.4 /100 | #280 | Tragic 1.5% |
| Tohono O'odham | 0.4 /100 | #281 | Tragic 1.5% |
| British West Indians | 0.3 /100 | #282 | Tragic 1.5% |
| Central Americans | 0.3 /100 | #283 | Tragic 1.5% |
| Jamaicans | 0.3 /100 | #284 | Tragic 1.5% |
| Malaysians | 0.3 /100 | #285 | Tragic 1.5% |
| Cherokee | 0.3 /100 | #286 | Tragic 1.5% |
| Cajuns | 0.3 /100 | #287 | Tragic 1.5% |
| Immigrants | El Salvador | 0.3 /100 | #288 | Tragic 1.4% |
| Cape Verdeans | 0.3 /100 | #289 | Tragic 1.4% |
| Choctaw | 0.3 /100 | #290 | Tragic 1.4% |
Demographics Similar to Immigrants from Mexico by Doctorate Degree
In terms of doctorate degree, the demographic groups most similar to Immigrants from Mexico are Lumbee (1.1%, a difference of 1.5%), Fijian (1.1%, a difference of 2.1%), Spanish American Indian (1.1%, a difference of 4.4%), Arapaho (1.2%, a difference of 5.6%), and Mexican (1.2%, a difference of 5.9%).
| Demographics | Rating | Rank | Doctorate Degree |
| Immigrants | Caribbean | 0.0 /100 | #333 | Tragic 1.3% |
| Immigrants | Dominican Republic | 0.0 /100 | #334 | Tragic 1.3% |
| Immigrants | Haiti | 0.0 /100 | #335 | Tragic 1.3% |
| Nepalese | 0.0 /100 | #336 | Tragic 1.3% |
| Bangladeshis | 0.0 /100 | #337 | Tragic 1.2% |
| Puget Sound Salish | 0.0 /100 | #338 | Tragic 1.2% |
| Immigrants | Central America | 0.0 /100 | #339 | Tragic 1.2% |
| Immigrants | Cuba | 0.0 /100 | #340 | Tragic 1.2% |
| Mexicans | 0.0 /100 | #341 | Tragic 1.2% |
| Arapaho | 0.0 /100 | #342 | Tragic 1.2% |
| Fijians | 0.0 /100 | #343 | Tragic 1.1% |
| Immigrants | Mexico | 0.0 /100 | #344 | Tragic 1.1% |
| Lumbee | 0.0 /100 | #345 | Tragic 1.1% |
| Spanish American Indians | 0.0 /100 | #346 | Tragic 1.1% |
| Houma | 0.0 /100 | #347 | Tragic 0.96% |