Central American Indian vs Bangladeshi College, Under 1 year
COMPARE
Central American Indian
Bangladeshi
College, Under 1 year
College, Under 1 year Comparison
Central American Indians
Bangladeshis
59.0%
COLLEGE, UNDER 1 YEAR
0.0/ 100
METRIC RATING
296th/ 347
METRIC RANK
61.4%
COLLEGE, UNDER 1 YEAR
0.4/ 100
METRIC RATING
256th/ 347
METRIC RANK
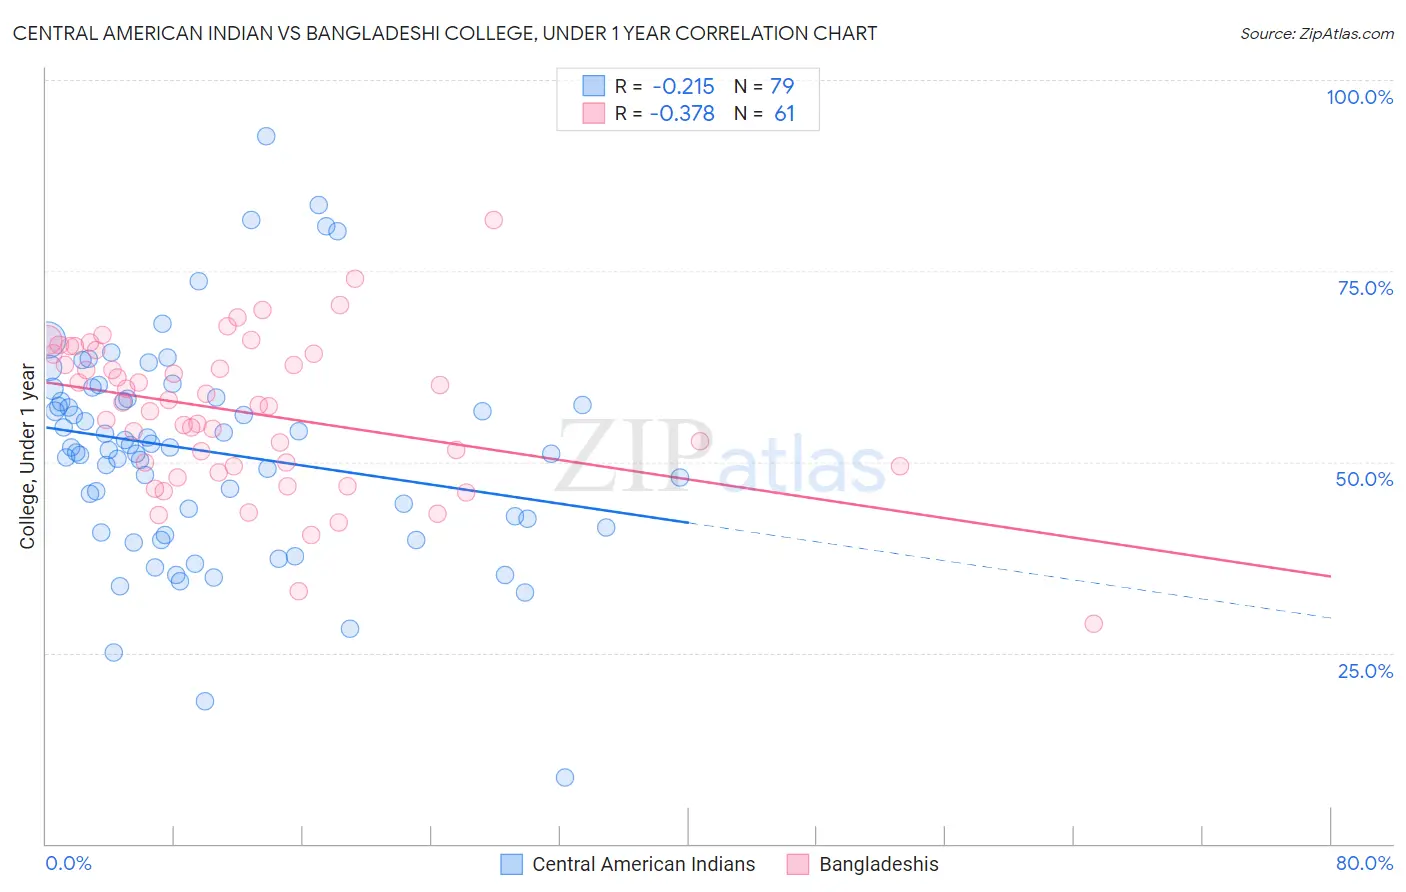
Central American Indian vs Bangladeshi College, Under 1 year Correlation Chart
The statistical analysis conducted on geographies consisting of 326,142,761 people shows a weak negative correlation between the proportion of Central American Indians and percentage of population with at least college, under 1 year education in the United States with a correlation coefficient (R) of -0.215 and weighted average of 59.0%. Similarly, the statistical analysis conducted on geographies consisting of 141,449,898 people shows a mild negative correlation between the proportion of Bangladeshis and percentage of population with at least college, under 1 year education in the United States with a correlation coefficient (R) of -0.378 and weighted average of 61.4%, a difference of 3.9%.
College, Under 1 year Correlation Summary
| Measurement | Central American Indian | Bangladeshi |
| Minimum | 8.7% | 28.8% |
| Maximum | 92.6% | 81.6% |
| Range | 83.9% | 52.9% |
| Mean | 51.3% | 56.4% |
| Median | 51.8% | 57.4% |
| Interquartile 25% (IQ1) | 41.5% | 49.5% |
| Interquartile 75% (IQ3) | 58.2% | 64.1% |
| Interquartile Range (IQR) | 16.8% | 14.7% |
| Standard Deviation (Sample) | 14.2% | 9.9% |
| Standard Deviation (Population) | 14.1% | 9.8% |
Similar Demographics by College, Under 1 year
Demographics Similar to Central American Indians by College, Under 1 year
In terms of college, under 1 year, the demographic groups most similar to Central American Indians are Immigrants from Grenada (59.1%, a difference of 0.040%), Guyanese (59.0%, a difference of 0.040%), Immigrants from Belize (59.1%, a difference of 0.14%), Seminole (59.1%, a difference of 0.16%), and Nicaraguan (59.2%, a difference of 0.35%).
| Demographics | Rating | Rank | College, Under 1 year |
| Choctaw | 0.0 /100 | #289 | Tragic 59.3% |
| Ecuadorians | 0.0 /100 | #290 | Tragic 59.3% |
| Creek | 0.0 /100 | #291 | Tragic 59.3% |
| Nicaraguans | 0.0 /100 | #292 | Tragic 59.2% |
| Seminole | 0.0 /100 | #293 | Tragic 59.1% |
| Immigrants | Belize | 0.0 /100 | #294 | Tragic 59.1% |
| Immigrants | Grenada | 0.0 /100 | #295 | Tragic 59.1% |
| Central American Indians | 0.0 /100 | #296 | Tragic 59.0% |
| Guyanese | 0.0 /100 | #297 | Tragic 59.0% |
| Immigrants | Ecuador | 0.0 /100 | #298 | Tragic 58.7% |
| Cubans | 0.0 /100 | #299 | Tragic 58.6% |
| Immigrants | Guyana | 0.0 /100 | #300 | Tragic 58.5% |
| Mexican American Indians | 0.0 /100 | #301 | Tragic 58.1% |
| Apache | 0.0 /100 | #302 | Tragic 58.0% |
| Immigrants | Dominica | 0.0 /100 | #303 | Tragic 57.9% |
Demographics Similar to Bangladeshis by College, Under 1 year
In terms of college, under 1 year, the demographic groups most similar to Bangladeshis are Comanche (61.4%, a difference of 0.040%), Immigrants from Laos (61.3%, a difference of 0.11%), West Indian (61.5%, a difference of 0.17%), Japanese (61.5%, a difference of 0.17%), and Immigrants from Cambodia (61.5%, a difference of 0.17%).
| Demographics | Rating | Rank | College, Under 1 year |
| Vietnamese | 0.5 /100 | #249 | Tragic 61.7% |
| Immigrants | Congo | 0.5 /100 | #250 | Tragic 61.7% |
| Immigrants | Micronesia | 0.5 /100 | #251 | Tragic 61.5% |
| West Indians | 0.4 /100 | #252 | Tragic 61.5% |
| Japanese | 0.4 /100 | #253 | Tragic 61.5% |
| Immigrants | Cambodia | 0.4 /100 | #254 | Tragic 61.5% |
| Comanche | 0.4 /100 | #255 | Tragic 61.4% |
| Bangladeshis | 0.4 /100 | #256 | Tragic 61.4% |
| Immigrants | Laos | 0.3 /100 | #257 | Tragic 61.3% |
| Immigrants | Bangladesh | 0.3 /100 | #258 | Tragic 61.3% |
| Indonesians | 0.3 /100 | #259 | Tragic 61.2% |
| Blackfeet | 0.3 /100 | #260 | Tragic 61.1% |
| Africans | 0.3 /100 | #261 | Tragic 61.1% |
| Barbadians | 0.2 /100 | #262 | Tragic 61.1% |
| Shoshone | 0.2 /100 | #263 | Tragic 61.1% |