Celtic vs French American Indian College, 1 year or more
COMPARE
Celtic
French American Indian
College, 1 year or more
College, 1 year or more Comparison
Celtics
French American Indians
59.4%
COLLEGE, 1 YEAR OR MORE
50.0/ 100
METRIC RATING
174th/ 347
METRIC RANK
55.8%
COLLEGE, 1 YEAR OR MORE
1.0/ 100
METRIC RATING
241st/ 347
METRIC RANK
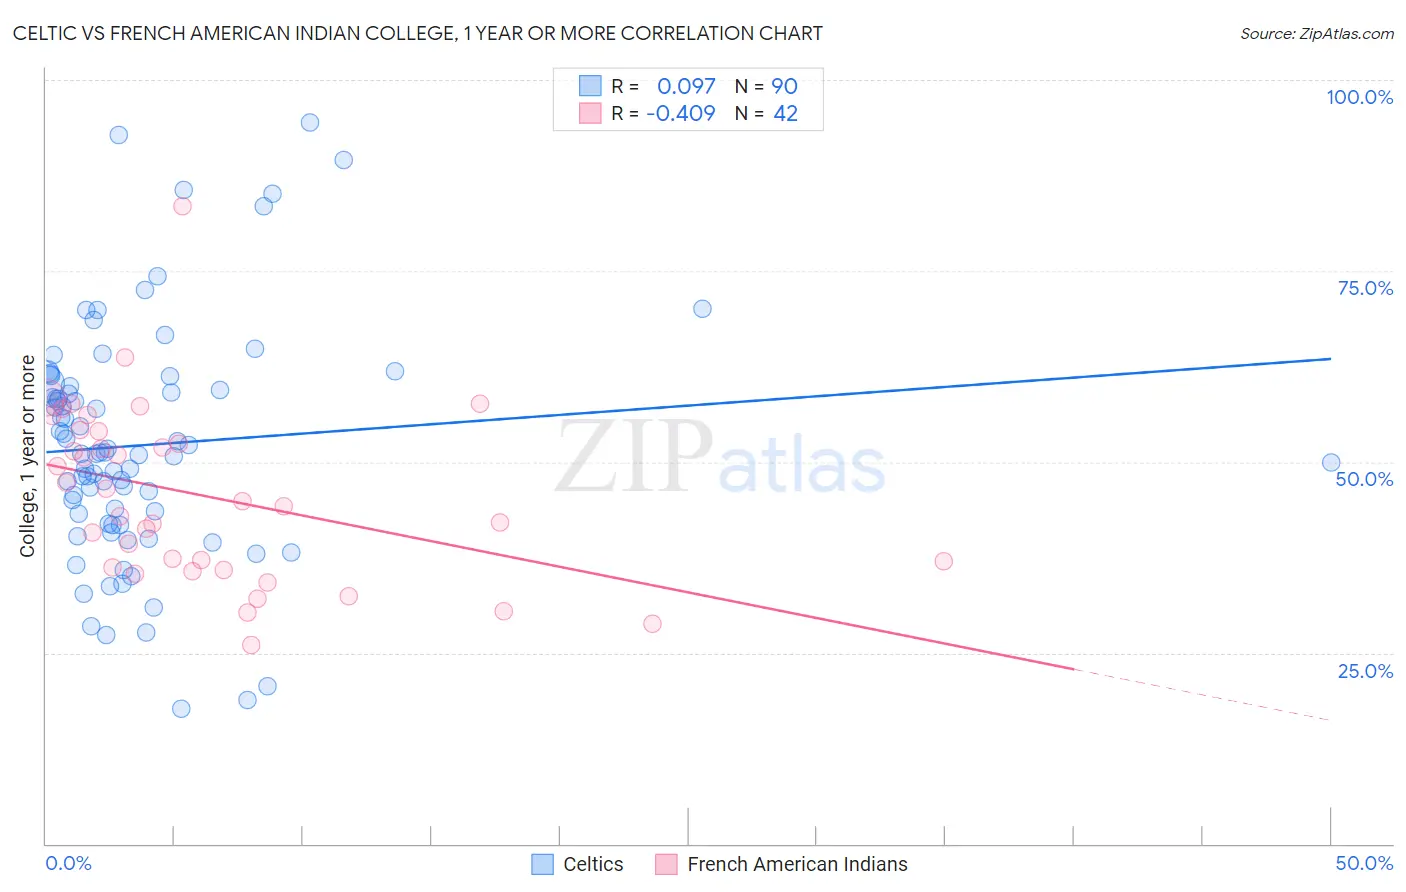
Celtic vs French American Indian College, 1 year or more Correlation Chart
The statistical analysis conducted on geographies consisting of 168,877,347 people shows a slight positive correlation between the proportion of Celtics and percentage of population with at least college, 1 year or more education in the United States with a correlation coefficient (R) of 0.097 and weighted average of 59.4%. Similarly, the statistical analysis conducted on geographies consisting of 131,976,089 people shows a moderate negative correlation between the proportion of French American Indians and percentage of population with at least college, 1 year or more education in the United States with a correlation coefficient (R) of -0.409 and weighted average of 55.8%, a difference of 6.4%.
College, 1 year or more Correlation Summary
| Measurement | Celtic | French American Indian |
| Minimum | 17.6% | 26.1% |
| Maximum | 94.4% | 83.5% |
| Range | 76.8% | 57.5% |
| Mean | 52.2% | 45.6% |
| Median | 51.2% | 44.5% |
| Interquartile 25% (IQ1) | 41.8% | 36.2% |
| Interquartile 75% (IQ3) | 59.9% | 54.0% |
| Interquartile Range (IQR) | 18.0% | 17.7% |
| Standard Deviation (Sample) | 15.4% | 11.5% |
| Standard Deviation (Population) | 15.4% | 11.4% |
Similar Demographics by College, 1 year or more
Demographics Similar to Celtics by College, 1 year or more
In terms of college, 1 year or more, the demographic groups most similar to Celtics are Sri Lankan (59.4%, a difference of 0.050%), Immigrants from Oceania (59.4%, a difference of 0.060%), Immigrants from Poland (59.4%, a difference of 0.060%), Tlingit-Haida (59.4%, a difference of 0.080%), and Czechoslovakian (59.4%, a difference of 0.090%).
| Demographics | Rating | Rank | College, 1 year or more |
| Immigrants | North Macedonia | 53.1 /100 | #167 | Average 59.5% |
| Hungarians | 52.9 /100 | #168 | Average 59.5% |
| Immigrants | Southern Europe | 52.7 /100 | #169 | Average 59.5% |
| Welsh | 52.4 /100 | #170 | Average 59.5% |
| Immigrants | Albania | 52.3 /100 | #171 | Average 59.5% |
| Immigrants | Sierra Leone | 52.2 /100 | #172 | Average 59.5% |
| Immigrants | Oceania | 51.2 /100 | #173 | Average 59.4% |
| Celtics | 50.0 /100 | #174 | Average 59.4% |
| Sri Lankans | 49.0 /100 | #175 | Average 59.4% |
| Immigrants | Poland | 48.9 /100 | #176 | Average 59.4% |
| Tlingit-Haida | 48.4 /100 | #177 | Average 59.4% |
| Czechoslovakians | 48.3 /100 | #178 | Average 59.4% |
| Bermudans | 46.6 /100 | #179 | Average 59.3% |
| Yugoslavians | 44.1 /100 | #180 | Average 59.2% |
| Swiss | 43.4 /100 | #181 | Average 59.2% |
Demographics Similar to French American Indians by College, 1 year or more
In terms of college, 1 year or more, the demographic groups most similar to French American Indians are Trinidadian and Tobagonian (55.8%, a difference of 0.050%), Marshallese (55.8%, a difference of 0.11%), Osage (55.8%, a difference of 0.12%), Puget Sound Salish (55.9%, a difference of 0.14%), and Chippewa (55.7%, a difference of 0.24%).
| Demographics | Rating | Rank | College, 1 year or more |
| Spanish Americans | 1.8 /100 | #234 | Tragic 56.3% |
| West Indians | 1.8 /100 | #235 | Tragic 56.3% |
| Iroquois | 1.7 /100 | #236 | Tragic 56.2% |
| Samoans | 1.6 /100 | #237 | Tragic 56.2% |
| Barbadians | 1.3 /100 | #238 | Tragic 56.0% |
| Puget Sound Salish | 1.1 /100 | #239 | Tragic 55.9% |
| Trinidadians and Tobagonians | 1.1 /100 | #240 | Tragic 55.8% |
| French American Indians | 1.0 /100 | #241 | Tragic 55.8% |
| Marshallese | 1.0 /100 | #242 | Tragic 55.8% |
| Osage | 1.0 /100 | #243 | Tragic 55.8% |
| Chippewa | 0.9 /100 | #244 | Tragic 55.7% |
| Immigrants | Liberia | 0.8 /100 | #245 | Tragic 55.7% |
| Malaysians | 0.8 /100 | #246 | Tragic 55.6% |
| Hawaiians | 0.8 /100 | #247 | Tragic 55.6% |
| Immigrants | Congo | 0.8 /100 | #248 | Tragic 55.6% |