Celtic vs Immigrants from Romania Unemployment Among Seniors over 75 years
COMPARE
Celtic
Immigrants from Romania
Unemployment Among Seniors over 75 years
Unemployment Among Seniors over 75 years Comparison
Celtics
Immigrants from Romania
9.3%
UNEMPLOYMENT AMONG SENIORS OVER 75 YEARS
0.8/ 100
METRIC RATING
261st/ 347
METRIC RANK
8.5%
UNEMPLOYMENT AMONG SENIORS OVER 75 YEARS
86.2/ 100
METRIC RATING
145th/ 347
METRIC RANK
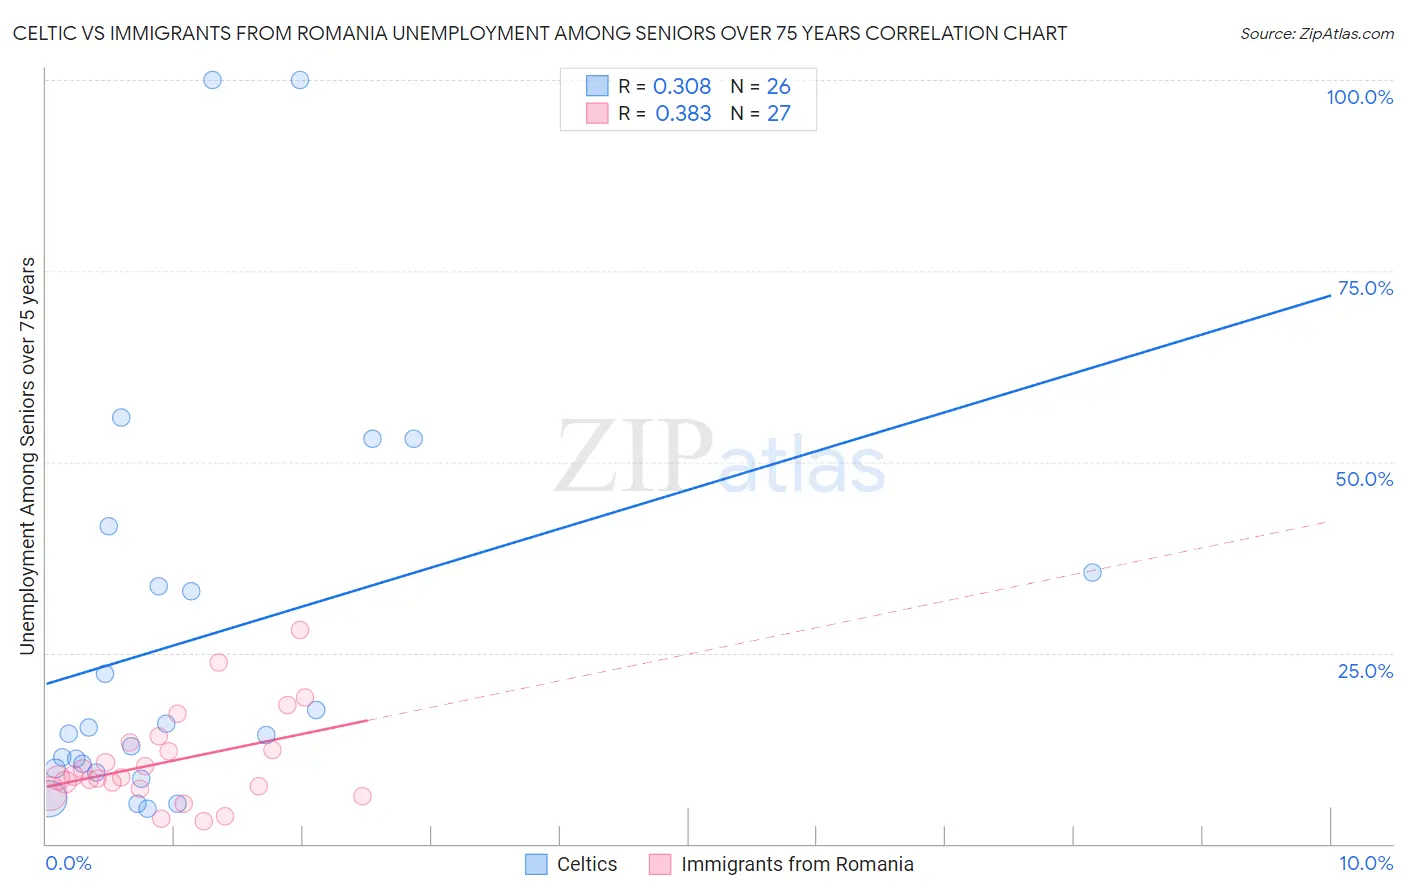
Celtic vs Immigrants from Romania Unemployment Among Seniors over 75 years Correlation Chart
The statistical analysis conducted on geographies consisting of 110,310,169 people shows a mild positive correlation between the proportion of Celtics and unemployment rate among seniors over the age of 75 in the United States with a correlation coefficient (R) of 0.308 and weighted average of 9.3%. Similarly, the statistical analysis conducted on geographies consisting of 155,148,035 people shows a mild positive correlation between the proportion of Immigrants from Romania and unemployment rate among seniors over the age of 75 in the United States with a correlation coefficient (R) of 0.383 and weighted average of 8.5%, a difference of 9.1%.
Unemployment Among Seniors over 75 years Correlation Summary
| Measurement | Celtic | Immigrants from Romania |
| Minimum | 4.6% | 3.0% |
| Maximum | 100.0% | 28.1% |
| Range | 95.4% | 25.1% |
| Mean | 26.9% | 10.8% |
| Median | 14.8% | 8.7% |
| Interquartile 25% (IQ1) | 9.8% | 7.3% |
| Interquartile 75% (IQ3) | 35.5% | 13.3% |
| Interquartile Range (IQR) | 25.7% | 6.1% |
| Standard Deviation (Sample) | 26.6% | 6.1% |
| Standard Deviation (Population) | 26.1% | 5.9% |
Similar Demographics by Unemployment Among Seniors over 75 years
Demographics Similar to Celtics by Unemployment Among Seniors over 75 years
In terms of unemployment among seniors over 75 years, the demographic groups most similar to Celtics are Austrian (9.3%, a difference of 0.10%), Ukrainian (9.3%, a difference of 0.22%), Iroquois (9.3%, a difference of 0.23%), Immigrants from Cameroon (9.3%, a difference of 0.26%), and Slovene (9.3%, a difference of 0.31%).
| Demographics | Rating | Rank | Unemployment Among Seniors over 75 years |
| Immigrants | Ghana | 1.7 /100 | #254 | Tragic 9.2% |
| Immigrants | Scotland | 1.4 /100 | #255 | Tragic 9.2% |
| Brazilians | 1.3 /100 | #256 | Tragic 9.3% |
| Hawaiians | 1.2 /100 | #257 | Tragic 9.3% |
| Immigrants | England | 1.0 /100 | #258 | Tragic 9.3% |
| Slovenes | 1.0 /100 | #259 | Tragic 9.3% |
| Immigrants | Cameroon | 1.0 /100 | #260 | Tragic 9.3% |
| Celtics | 0.8 /100 | #261 | Tragic 9.3% |
| Austrians | 0.7 /100 | #262 | Tragic 9.3% |
| Ukrainians | 0.7 /100 | #263 | Tragic 9.3% |
| Iroquois | 0.7 /100 | #264 | Tragic 9.3% |
| Palestinians | 0.6 /100 | #265 | Tragic 9.3% |
| Blacks/African Americans | 0.5 /100 | #266 | Tragic 9.4% |
| Immigrants | Mexico | 0.4 /100 | #267 | Tragic 9.4% |
| Greeks | 0.4 /100 | #268 | Tragic 9.4% |
Demographics Similar to Immigrants from Romania by Unemployment Among Seniors over 75 years
In terms of unemployment among seniors over 75 years, the demographic groups most similar to Immigrants from Romania are Immigrants from South Eastern Asia (8.5%, a difference of 0.050%), Colombian (8.5%, a difference of 0.060%), Immigrants from Costa Rica (8.5%, a difference of 0.070%), Immigrants from Sierra Leone (8.5%, a difference of 0.070%), and Immigrants from Colombia (8.5%, a difference of 0.070%).
| Demographics | Rating | Rank | Unemployment Among Seniors over 75 years |
| Immigrants | Bulgaria | 89.6 /100 | #138 | Excellent 8.5% |
| Barbadians | 88.6 /100 | #139 | Excellent 8.5% |
| South Americans | 87.9 /100 | #140 | Excellent 8.5% |
| Immigrants | Bolivia | 87.9 /100 | #141 | Excellent 8.5% |
| Immigrants | Ukraine | 87.0 /100 | #142 | Excellent 8.5% |
| Immigrants | Costa Rica | 86.8 /100 | #143 | Excellent 8.5% |
| Colombians | 86.7 /100 | #144 | Excellent 8.5% |
| Immigrants | Romania | 86.2 /100 | #145 | Excellent 8.5% |
| Immigrants | South Eastern Asia | 85.8 /100 | #146 | Excellent 8.5% |
| Immigrants | Sierra Leone | 85.6 /100 | #147 | Excellent 8.5% |
| Immigrants | Colombia | 85.6 /100 | #148 | Excellent 8.5% |
| Immigrants | Ecuador | 84.6 /100 | #149 | Excellent 8.5% |
| Paiute | 82.5 /100 | #150 | Excellent 8.6% |
| Immigrants | Bosnia and Herzegovina | 80.6 /100 | #151 | Excellent 8.6% |
| Latvians | 80.5 /100 | #152 | Excellent 8.6% |