Carpatho Rusyn vs Indonesian Average Family Size
COMPARE
Carpatho Rusyn
Indonesian
Average Family Size
Average Family Size Comparison
Carpatho Rusyns
Indonesians
3.06
AVERAGE FAMILY SIZE
0.0/ 100
METRIC RATING
347th/ 347
METRIC RANK
3.28
AVERAGE FAMILY SIZE
96.2/ 100
METRIC RATING
111th/ 347
METRIC RANK
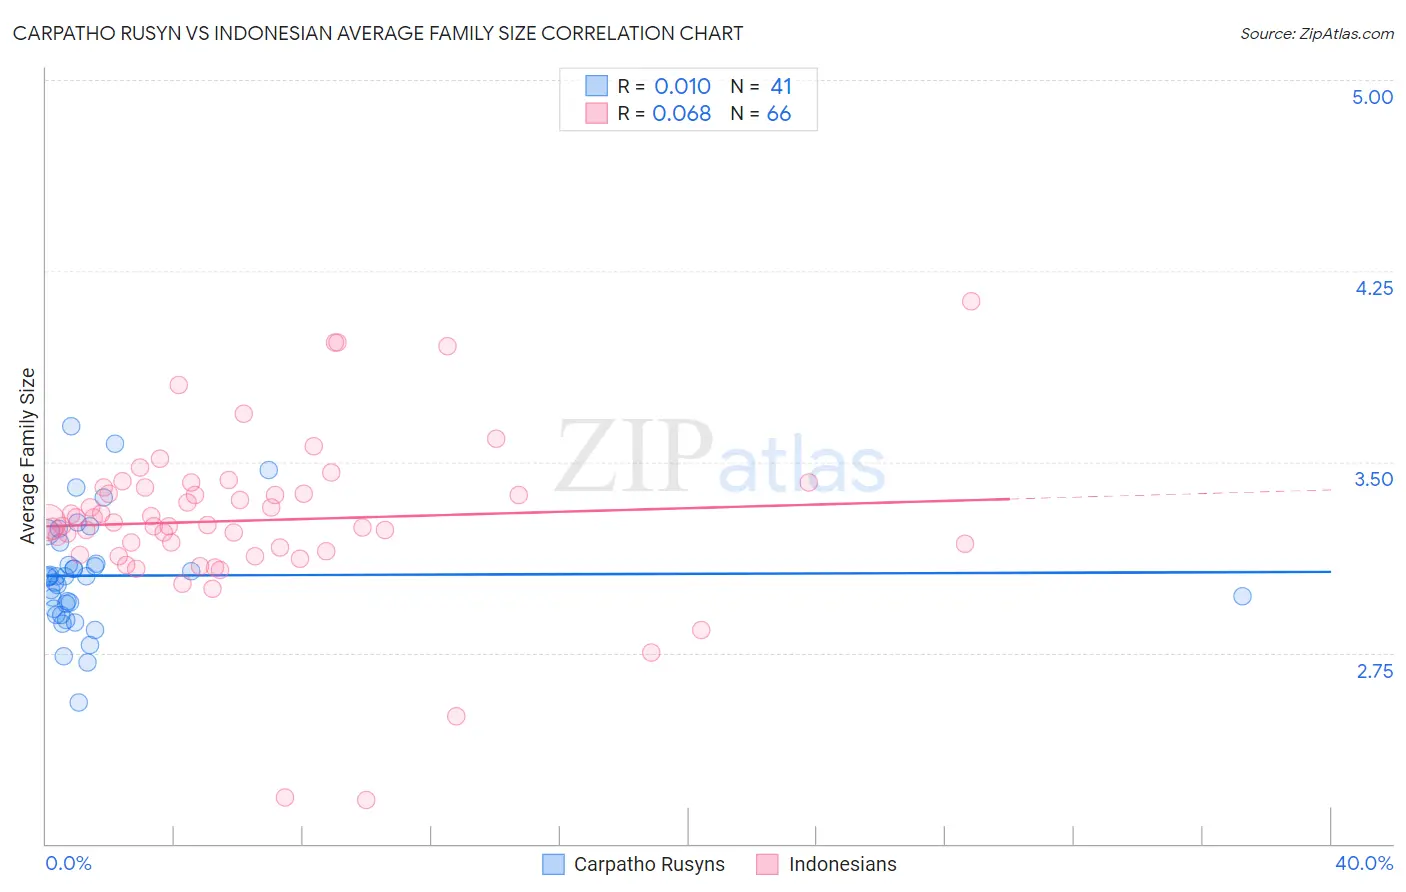
Carpatho Rusyn vs Indonesian Average Family Size Correlation Chart
The statistical analysis conducted on geographies consisting of 58,871,605 people shows no correlation between the proportion of Carpatho Rusyns and average family size in the United States with a correlation coefficient (R) of 0.010 and weighted average of 3.06. Similarly, the statistical analysis conducted on geographies consisting of 162,608,656 people shows a slight positive correlation between the proportion of Indonesians and average family size in the United States with a correlation coefficient (R) of 0.068 and weighted average of 3.28, a difference of 7.0%.
Average Family Size Correlation Summary
| Measurement | Carpatho Rusyn | Indonesian |
| Minimum | 2.56 | 2.17 |
| Maximum | 3.64 | 4.13 |
| Range | 1.08 | 1.96 |
| Mean | 3.05 | 3.27 |
| Median | 3.05 | 3.25 |
| Interquartile 25% (IQ1) | 2.91 | 3.15 |
| Interquartile 75% (IQ3) | 3.14 | 3.40 |
| Interquartile Range (IQR) | 0.23 | 0.25 |
| Standard Deviation (Sample) | 0.22 | 0.33 |
| Standard Deviation (Population) | 0.22 | 0.33 |
Similar Demographics by Average Family Size
Demographics Similar to Carpatho Rusyns by Average Family Size
In terms of average family size, the demographic groups most similar to Carpatho Rusyns are Slovak (3.06, a difference of 0.060%), Slovene (3.07, a difference of 0.35%), French Canadian (3.07, a difference of 0.39%), Norwegian (3.08, a difference of 0.63%), and German (3.09, a difference of 0.86%).
| Demographics | Rating | Rank | Average Family Size |
| Estonians | 0.0 /100 | #333 | Tragic 3.10 |
| Lithuanians | 0.0 /100 | #334 | Tragic 3.10 |
| Luxembourgers | 0.0 /100 | #335 | Tragic 3.10 |
| Irish | 0.0 /100 | #336 | Tragic 3.10 |
| Swedes | 0.0 /100 | #337 | Tragic 3.10 |
| French | 0.0 /100 | #338 | Tragic 3.10 |
| Croatians | 0.0 /100 | #339 | Tragic 3.10 |
| Finns | 0.0 /100 | #340 | Tragic 3.09 |
| Poles | 0.0 /100 | #341 | Tragic 3.09 |
| Germans | 0.0 /100 | #342 | Tragic 3.09 |
| Norwegians | 0.0 /100 | #343 | Tragic 3.08 |
| French Canadians | 0.0 /100 | #344 | Tragic 3.07 |
| Slovenes | 0.0 /100 | #345 | Tragic 3.07 |
| Slovaks | 0.0 /100 | #346 | Tragic 3.06 |
| Carpatho Rusyns | 0.0 /100 | #347 | Tragic 3.06 |
Demographics Similar to Indonesians by Average Family Size
In terms of average family size, the demographic groups most similar to Indonesians are Bahamian (3.28, a difference of 0.050%), Puerto Rican (3.28, a difference of 0.060%), Black/African American (3.27, a difference of 0.060%), Immigrants from Panama (3.27, a difference of 0.070%), and Asian (3.28, a difference of 0.11%).
| Demographics | Rating | Rank | Average Family Size |
| Bolivians | 98.3 /100 | #104 | Exceptional 3.29 |
| Immigrants | Ghana | 98.1 /100 | #105 | Exceptional 3.29 |
| Paiute | 98.0 /100 | #106 | Exceptional 3.29 |
| Ghanaians | 98.0 /100 | #107 | Exceptional 3.29 |
| Asians | 97.0 /100 | #108 | Exceptional 3.28 |
| Puerto Ricans | 96.7 /100 | #109 | Exceptional 3.28 |
| Bahamians | 96.6 /100 | #110 | Exceptional 3.28 |
| Indonesians | 96.2 /100 | #111 | Exceptional 3.28 |
| Blacks/African Americans | 95.7 /100 | #112 | Exceptional 3.27 |
| Immigrants | Panama | 95.6 /100 | #113 | Exceptional 3.27 |
| South Americans | 95.1 /100 | #114 | Exceptional 3.27 |
| Immigrants | Liberia | 95.0 /100 | #115 | Exceptional 3.27 |
| Immigrants | South America | 95.0 /100 | #116 | Exceptional 3.27 |
| Kiowa | 94.8 /100 | #117 | Exceptional 3.27 |
| Immigrants | Asia | 94.0 /100 | #118 | Exceptional 3.27 |