Carpatho Rusyn vs Immigrants from France Professional Degree
COMPARE
Carpatho Rusyn
Immigrants from France
Professional Degree
Professional Degree Comparison
Carpatho Rusyns
Immigrants from France
5.3%
PROFESSIONAL DEGREE
99.6/ 100
METRIC RATING
83rd/ 347
METRIC RANK
6.8%
PROFESSIONAL DEGREE
100.0/ 100
METRIC RATING
14th/ 347
METRIC RANK
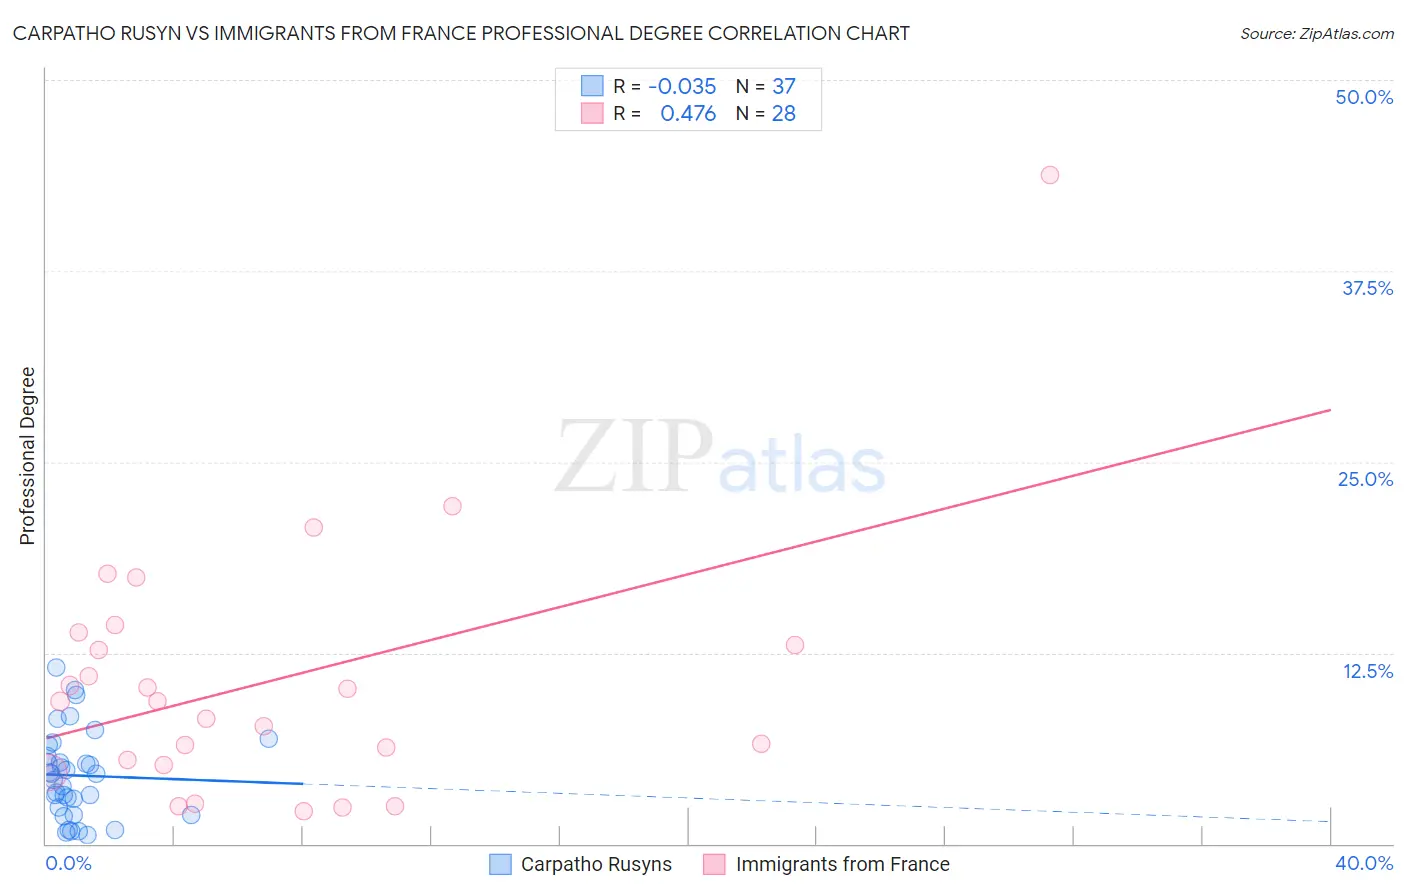
Carpatho Rusyn vs Immigrants from France Professional Degree Correlation Chart
The statistical analysis conducted on geographies consisting of 58,844,237 people shows no correlation between the proportion of Carpatho Rusyns and percentage of population with at least professional degree education in the United States with a correlation coefficient (R) of -0.035 and weighted average of 5.3%. Similarly, the statistical analysis conducted on geographies consisting of 287,646,989 people shows a moderate positive correlation between the proportion of Immigrants from France and percentage of population with at least professional degree education in the United States with a correlation coefficient (R) of 0.476 and weighted average of 6.8%, a difference of 29.0%.
Professional Degree Correlation Summary
| Measurement | Carpatho Rusyn | Immigrants from France |
| Minimum | 0.59% | 2.1% |
| Maximum | 11.6% | 43.8% |
| Range | 11.0% | 41.6% |
| Mean | 4.5% | 10.7% |
| Median | 4.6% | 9.3% |
| Interquartile 25% (IQ1) | 2.1% | 5.3% |
| Interquartile 75% (IQ3) | 6.1% | 13.5% |
| Interquartile Range (IQR) | 4.0% | 8.1% |
| Standard Deviation (Sample) | 2.8% | 8.5% |
| Standard Deviation (Population) | 2.8% | 8.4% |
Similar Demographics by Professional Degree
Demographics Similar to Carpatho Rusyns by Professional Degree
In terms of professional degree, the demographic groups most similar to Carpatho Rusyns are Immigrants from Croatia (5.3%, a difference of 0.0%), Immigrants from Zimbabwe (5.3%, a difference of 0.020%), Greek (5.3%, a difference of 0.020%), Immigrants from Chile (5.3%, a difference of 0.13%), and Romanian (5.3%, a difference of 0.20%).
| Demographics | Rating | Rank | Professional Degree |
| Immigrants | Canada | 99.7 /100 | #76 | Exceptional 5.3% |
| Immigrants | Ethiopia | 99.7 /100 | #77 | Exceptional 5.3% |
| Armenians | 99.7 /100 | #78 | Exceptional 5.3% |
| Immigrants | North America | 99.7 /100 | #79 | Exceptional 5.3% |
| Immigrants | England | 99.6 /100 | #80 | Exceptional 5.3% |
| Immigrants | Brazil | 99.6 /100 | #81 | Exceptional 5.3% |
| Romanians | 99.6 /100 | #82 | Exceptional 5.3% |
| Carpatho Rusyns | 99.6 /100 | #83 | Exceptional 5.3% |
| Immigrants | Croatia | 99.6 /100 | #84 | Exceptional 5.3% |
| Immigrants | Zimbabwe | 99.6 /100 | #85 | Exceptional 5.3% |
| Greeks | 99.6 /100 | #86 | Exceptional 5.3% |
| Immigrants | Chile | 99.5 /100 | #87 | Exceptional 5.3% |
| Egyptians | 99.5 /100 | #88 | Exceptional 5.3% |
| Chileans | 99.5 /100 | #89 | Exceptional 5.3% |
| Immigrants | Scotland | 99.5 /100 | #90 | Exceptional 5.3% |
Demographics Similar to Immigrants from France by Professional Degree
In terms of professional degree, the demographic groups most similar to Immigrants from France are Immigrants from China (6.7%, a difference of 1.1%), Immigrants from Australia (6.9%, a difference of 1.5%), Immigrants from Sweden (6.7%, a difference of 1.5%), Israeli (6.9%, a difference of 1.9%), and Cypriot (6.9%, a difference of 2.0%).
| Demographics | Rating | Rank | Professional Degree |
| Eastern Europeans | 100.0 /100 | #7 | Exceptional 7.1% |
| Immigrants | Switzerland | 100.0 /100 | #8 | Exceptional 7.1% |
| Immigrants | Taiwan | 100.0 /100 | #9 | Exceptional 7.1% |
| Immigrants | Belgium | 100.0 /100 | #10 | Exceptional 7.0% |
| Cypriots | 100.0 /100 | #11 | Exceptional 6.9% |
| Israelis | 100.0 /100 | #12 | Exceptional 6.9% |
| Immigrants | Australia | 100.0 /100 | #13 | Exceptional 6.9% |
| Immigrants | France | 100.0 /100 | #14 | Exceptional 6.8% |
| Immigrants | China | 100.0 /100 | #15 | Exceptional 6.7% |
| Immigrants | Sweden | 100.0 /100 | #16 | Exceptional 6.7% |
| Immigrants | Eastern Asia | 100.0 /100 | #17 | Exceptional 6.6% |
| Soviet Union | 100.0 /100 | #18 | Exceptional 6.6% |
| Indians (Asian) | 100.0 /100 | #19 | Exceptional 6.5% |
| Immigrants | Denmark | 100.0 /100 | #20 | Exceptional 6.4% |
| Immigrants | Hong Kong | 100.0 /100 | #21 | Exceptional 6.4% |