Immigrants from Panama vs Chilean 3rd Grade
COMPARE
Immigrants from Panama
Chilean
3rd Grade
3rd Grade Comparison
Immigrants from Panama
Chileans
97.5%
3RD GRADE
5.2/ 100
METRIC RATING
219th/ 347
METRIC RANK
97.8%
3RD GRADE
55.3/ 100
METRIC RATING
167th/ 347
METRIC RANK
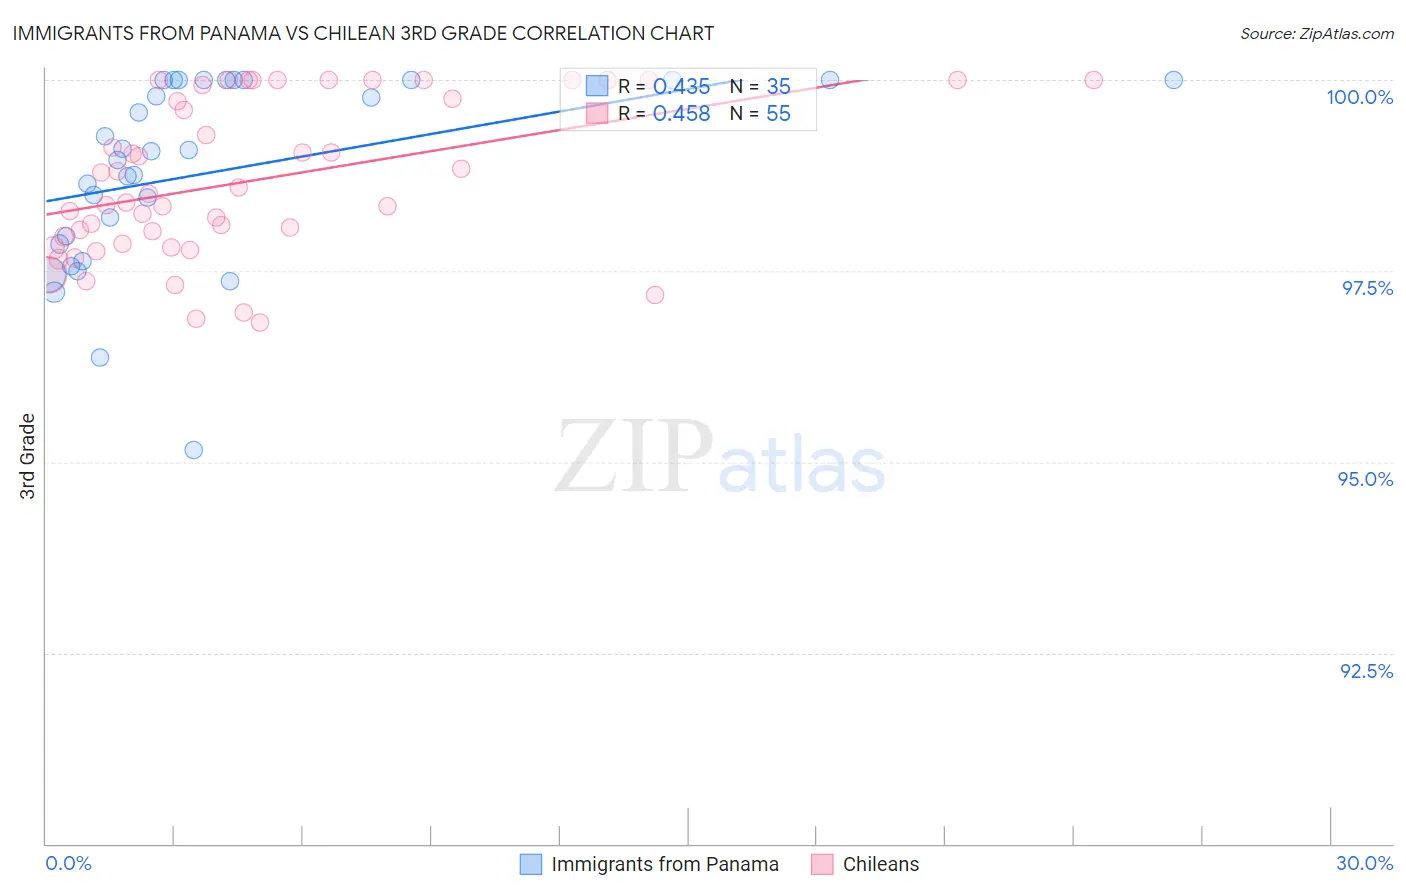
Immigrants from Panama vs Chilean 3rd Grade Correlation Chart
The statistical analysis conducted on geographies consisting of 221,182,871 people shows a moderate positive correlation between the proportion of Immigrants from Panama and percentage of population with at least 3rd grade education in the United States with a correlation coefficient (R) of 0.435 and weighted average of 97.5%. Similarly, the statistical analysis conducted on geographies consisting of 256,684,337 people shows a moderate positive correlation between the proportion of Chileans and percentage of population with at least 3rd grade education in the United States with a correlation coefficient (R) of 0.458 and weighted average of 97.8%, a difference of 0.27%.
3rd Grade Correlation Summary
| Measurement | Immigrants from Panama | Chilean |
| Minimum | 95.1% | 96.8% |
| Maximum | 100.0% | 100.0% |
| Range | 4.9% | 3.2% |
| Mean | 98.8% | 98.7% |
| Median | 99.1% | 98.5% |
| Interquartile 25% (IQ1) | 97.9% | 97.9% |
| Interquartile 75% (IQ3) | 100.0% | 99.9% |
| Interquartile Range (IQR) | 2.1% | 2.1% |
| Standard Deviation (Sample) | 1.2% | 1.0% |
| Standard Deviation (Population) | 1.2% | 1.00% |
Similar Demographics by 3rd Grade
Demographics Similar to Immigrants from Panama by 3rd Grade
In terms of 3rd grade, the demographic groups most similar to Immigrants from Panama are Immigrants from Nepal (97.5%, a difference of 0.0%), Immigrants from Morocco (97.5%, a difference of 0.0%), Uruguayan (97.5%, a difference of 0.0%), South American Indian (97.5%, a difference of 0.010%), and Sierra Leonean (97.5%, a difference of 0.010%).
| Demographics | Rating | Rank | 3rd Grade |
| Immigrants | Bahamas | 8.5 /100 | #212 | Tragic 97.6% |
| Moroccans | 8.5 /100 | #213 | Tragic 97.6% |
| Yuman | 8.4 /100 | #214 | Tragic 97.6% |
| Iraqis | 6.9 /100 | #215 | Tragic 97.5% |
| Samoans | 6.9 /100 | #216 | Tragic 97.5% |
| South American Indians | 5.7 /100 | #217 | Tragic 97.5% |
| Immigrants | Nepal | 5.3 /100 | #218 | Tragic 97.5% |
| Immigrants | Panama | 5.2 /100 | #219 | Tragic 97.5% |
| Immigrants | Morocco | 5.0 /100 | #220 | Tragic 97.5% |
| Uruguayans | 5.0 /100 | #221 | Tragic 97.5% |
| Sierra Leoneans | 4.6 /100 | #222 | Tragic 97.5% |
| Immigrants | Syria | 4.4 /100 | #223 | Tragic 97.5% |
| Bahamians | 4.4 /100 | #224 | Tragic 97.5% |
| Tongans | 4.3 /100 | #225 | Tragic 97.5% |
| Sudanese | 4.1 /100 | #226 | Tragic 97.5% |
Demographics Similar to Chileans by 3rd Grade
In terms of 3rd grade, the demographic groups most similar to Chileans are Immigrants from Bosnia and Herzegovina (97.8%, a difference of 0.0%), Ugandan (97.8%, a difference of 0.0%), Dutch West Indian (97.8%, a difference of 0.0%), Immigrants from Spain (97.8%, a difference of 0.0%), and Immigrants from Iran (97.8%, a difference of 0.010%).
| Demographics | Rating | Rank | 3rd Grade |
| Immigrants | Iran | 59.1 /100 | #160 | Average 97.8% |
| Albanians | 58.8 /100 | #161 | Average 97.8% |
| Immigrants | Jordan | 57.9 /100 | #162 | Average 97.8% |
| Marshallese | 57.2 /100 | #163 | Average 97.8% |
| Immigrants | Bosnia and Herzegovina | 56.2 /100 | #164 | Average 97.8% |
| Ugandans | 56.1 /100 | #165 | Average 97.8% |
| Dutch West Indians | 55.5 /100 | #166 | Average 97.8% |
| Chileans | 55.3 /100 | #167 | Average 97.8% |
| Immigrants | Spain | 54.3 /100 | #168 | Average 97.8% |
| Comanche | 53.8 /100 | #169 | Average 97.8% |
| Brazilians | 53.7 /100 | #170 | Average 97.8% |
| Kenyans | 51.8 /100 | #171 | Average 97.8% |
| Spanish Americans | 51.8 /100 | #172 | Average 97.8% |
| Immigrants | Korea | 50.9 /100 | #173 | Average 97.8% |
| Navajo | 50.0 /100 | #174 | Average 97.8% |