Tsimshian vs Bahamian 2nd Grade
COMPARE
Tsimshian
Bahamian
2nd Grade
2nd Grade Comparison
Tsimshian
Bahamians
98.8%
2ND GRADE
100.0/ 100
METRIC RATING
4th/ 347
METRIC RANK
97.7%
2ND GRADE
6.8/ 100
METRIC RATING
215th/ 347
METRIC RANK
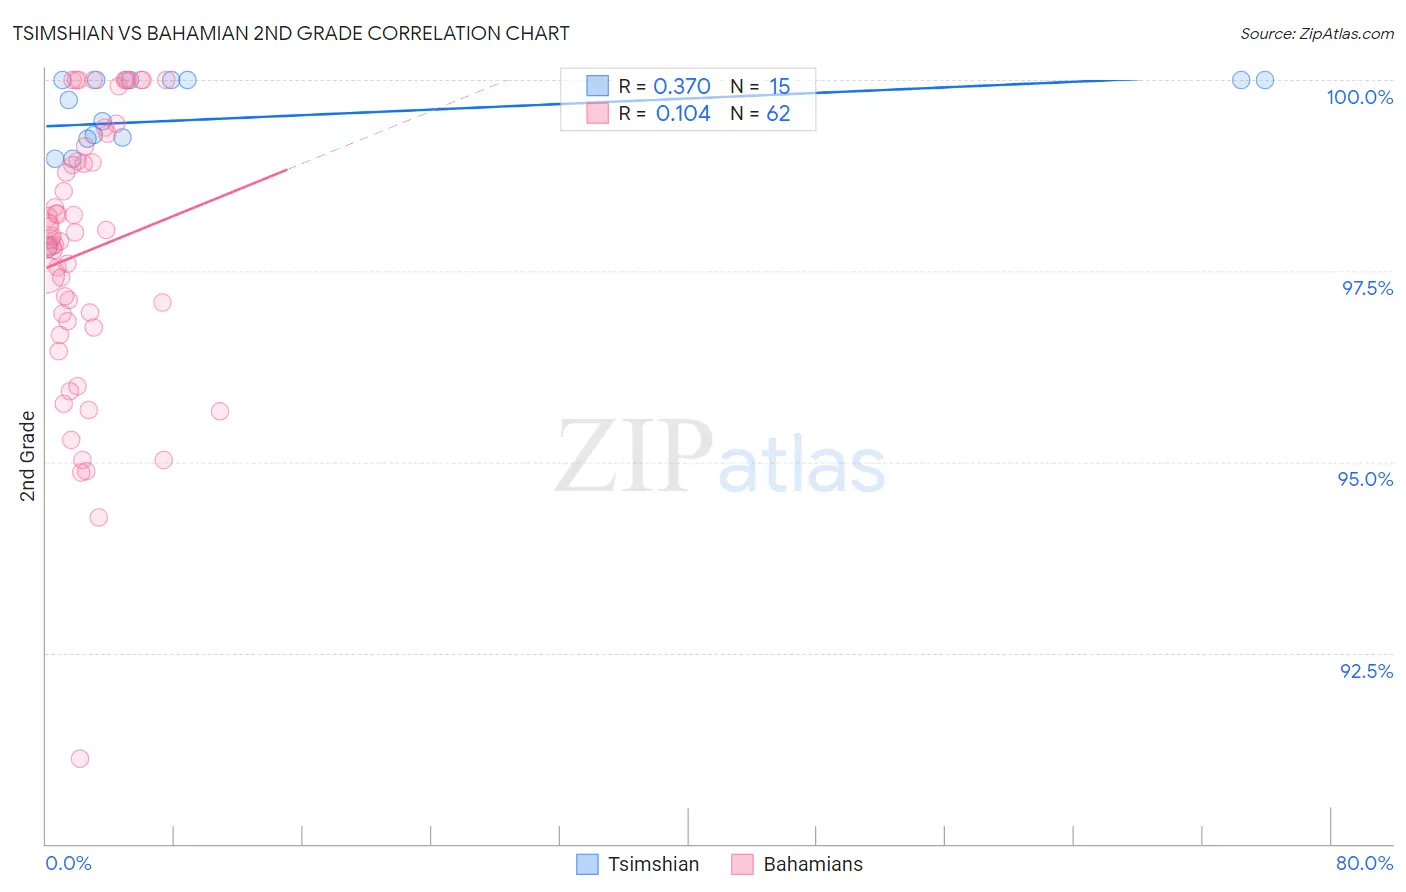
Tsimshian vs Bahamian 2nd Grade Correlation Chart
The statistical analysis conducted on geographies consisting of 15,626,544 people shows a mild positive correlation between the proportion of Tsimshian and percentage of population with at least 2nd grade education in the United States with a correlation coefficient (R) of 0.370 and weighted average of 98.8%. Similarly, the statistical analysis conducted on geographies consisting of 112,673,855 people shows a poor positive correlation between the proportion of Bahamians and percentage of population with at least 2nd grade education in the United States with a correlation coefficient (R) of 0.104 and weighted average of 97.7%, a difference of 1.2%.
2nd Grade Correlation Summary
| Measurement | Tsimshian | Bahamian |
| Minimum | 97.8% | 91.1% |
| Maximum | 100.0% | 100.0% |
| Range | 2.2% | 8.9% |
| Mean | 99.5% | 97.7% |
| Median | 99.7% | 97.9% |
| Interquartile 25% (IQ1) | 99.2% | 96.8% |
| Interquartile 75% (IQ3) | 100.0% | 98.9% |
| Interquartile Range (IQR) | 0.77% | 2.1% |
| Standard Deviation (Sample) | 0.62% | 1.8% |
| Standard Deviation (Population) | 0.60% | 1.8% |
Similar Demographics by 2nd Grade
Demographics Similar to Tsimshian by 2nd Grade
In terms of 2nd grade, the demographic groups most similar to Tsimshian are Inupiat (98.8%, a difference of 0.040%), Alaskan Athabascan (98.7%, a difference of 0.080%), Alaska Native (98.7%, a difference of 0.12%), Norwegian (98.7%, a difference of 0.13%), and German (98.7%, a difference of 0.15%).
| Demographics | Rating | Rank | 2nd Grade |
| Crow | 100.0 /100 | #1 | Exceptional 99.6% |
| Yup'ik | 100.0 /100 | #2 | Exceptional 99.2% |
| Inupiat | 100.0 /100 | #3 | Exceptional 98.8% |
| Tsimshian | 100.0 /100 | #4 | Exceptional 98.8% |
| Alaskan Athabascans | 100.0 /100 | #5 | Exceptional 98.7% |
| Alaska Natives | 100.0 /100 | #6 | Exceptional 98.7% |
| Norwegians | 100.0 /100 | #7 | Exceptional 98.7% |
| Germans | 100.0 /100 | #8 | Exceptional 98.7% |
| Slovaks | 100.0 /100 | #9 | Exceptional 98.7% |
| Slovenes | 100.0 /100 | #10 | Exceptional 98.6% |
| Tlingit-Haida | 100.0 /100 | #11 | Exceptional 98.6% |
| Carpatho Rusyns | 100.0 /100 | #12 | Exceptional 98.6% |
| English | 100.0 /100 | #13 | Exceptional 98.6% |
| Swedes | 100.0 /100 | #14 | Exceptional 98.6% |
| Scottish | 100.0 /100 | #15 | Exceptional 98.6% |
Demographics Similar to Bahamians by 2nd Grade
In terms of 2nd grade, the demographic groups most similar to Bahamians are Samoan (97.7%, a difference of 0.0%), South American Indian (97.7%, a difference of 0.0%), Uruguayan (97.7%, a difference of 0.010%), Immigrants from Bahamas (97.7%, a difference of 0.020%), and Moroccan (97.7%, a difference of 0.020%).
| Demographics | Rating | Rank | 2nd Grade |
| Immigrants | Northern Africa | 12.3 /100 | #208 | Poor 97.7% |
| Immigrants | Oceania | 10.9 /100 | #209 | Poor 97.7% |
| Costa Ricans | 10.5 /100 | #210 | Poor 97.7% |
| Laotians | 9.9 /100 | #211 | Tragic 97.7% |
| Immigrants | Bahamas | 8.4 /100 | #212 | Tragic 97.7% |
| Moroccans | 8.2 /100 | #213 | Tragic 97.7% |
| Samoans | 7.1 /100 | #214 | Tragic 97.7% |
| Bahamians | 6.8 /100 | #215 | Tragic 97.7% |
| South American Indians | 6.7 /100 | #216 | Tragic 97.7% |
| Uruguayans | 6.2 /100 | #217 | Tragic 97.7% |
| Sudanese | 5.7 /100 | #218 | Tragic 97.7% |
| Immigrants | Panama | 5.1 /100 | #219 | Tragic 97.6% |
| Immigrants | Morocco | 5.0 /100 | #220 | Tragic 97.6% |
| Iraqis | 4.6 /100 | #221 | Tragic 97.6% |
| Immigrants | Sudan | 4.5 /100 | #222 | Tragic 97.6% |