Cambodian vs Yakama Professional Degree
COMPARE
Cambodian
Yakama
Professional Degree
Professional Degree Comparison
Cambodians
Yakama
6.0%
PROFESSIONAL DEGREE
100.0/ 100
METRIC RATING
40th/ 347
METRIC RANK
3.1%
PROFESSIONAL DEGREE
0.0/ 100
METRIC RATING
332nd/ 347
METRIC RANK
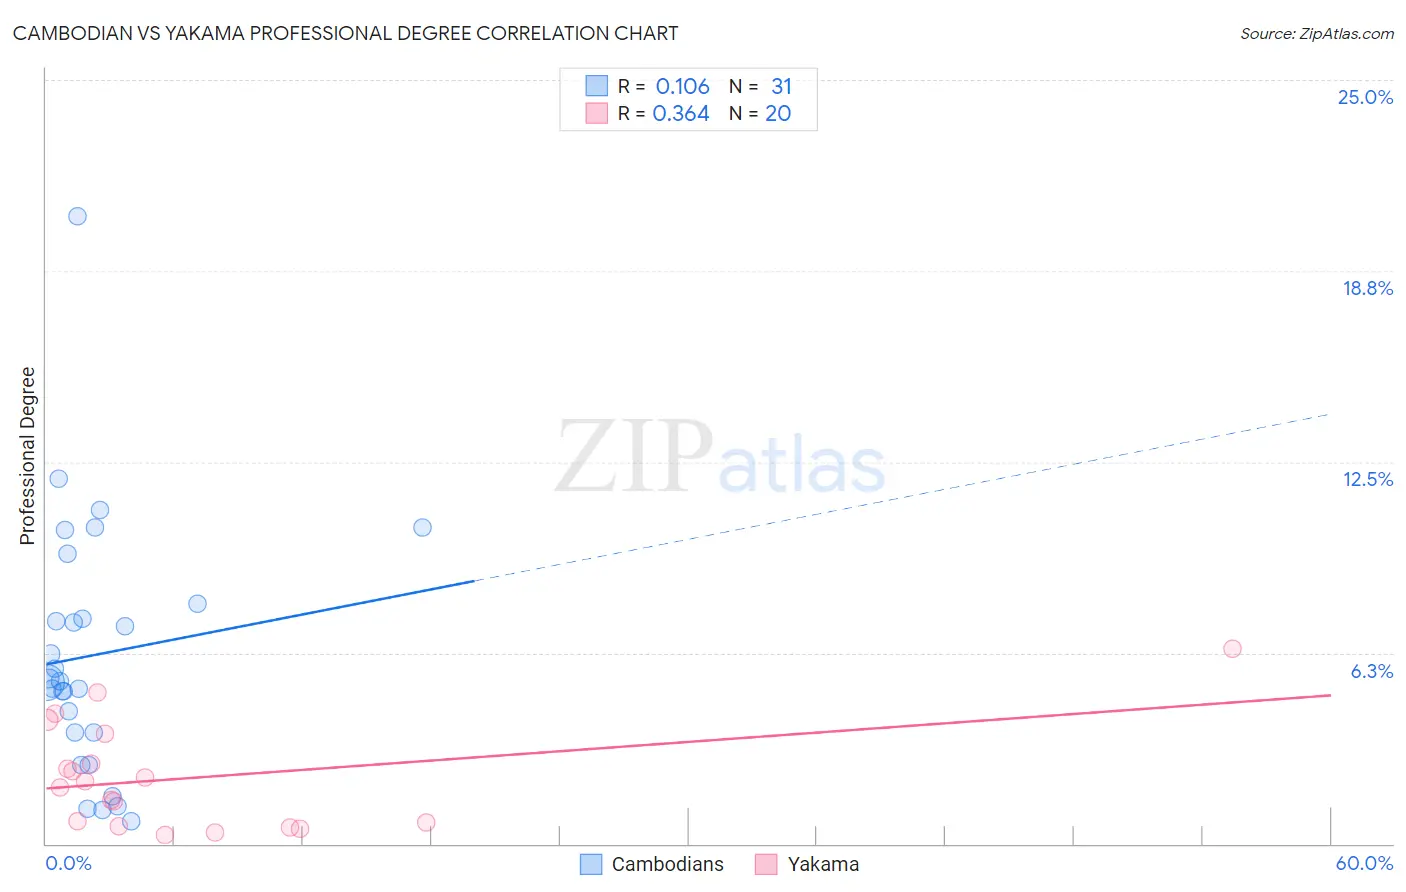
Cambodian vs Yakama Professional Degree Correlation Chart
The statistical analysis conducted on geographies consisting of 102,442,026 people shows a poor positive correlation between the proportion of Cambodians and percentage of population with at least professional degree education in the United States with a correlation coefficient (R) of 0.106 and weighted average of 6.0%. Similarly, the statistical analysis conducted on geographies consisting of 19,874,339 people shows a mild positive correlation between the proportion of Yakama and percentage of population with at least professional degree education in the United States with a correlation coefficient (R) of 0.364 and weighted average of 3.1%, a difference of 93.7%.
Professional Degree Correlation Summary
| Measurement | Cambodian | Yakama |
| Minimum | 0.74% | 0.31% |
| Maximum | 20.5% | 6.4% |
| Range | 19.8% | 6.1% |
| Mean | 6.2% | 2.2% |
| Median | 5.3% | 1.9% |
| Interquartile 25% (IQ1) | 3.6% | 0.64% |
| Interquartile 75% (IQ3) | 7.9% | 3.1% |
| Interquartile Range (IQR) | 4.2% | 2.5% |
| Standard Deviation (Sample) | 4.1% | 1.7% |
| Standard Deviation (Population) | 4.0% | 1.7% |
Similar Demographics by Professional Degree
Demographics Similar to Cambodians by Professional Degree
In terms of professional degree, the demographic groups most similar to Cambodians are New Zealander (6.0%, a difference of 0.18%), Estonian (6.0%, a difference of 0.19%), Immigrants from South Africa (6.0%, a difference of 0.47%), Immigrants from Saudi Arabia (5.9%, a difference of 0.52%), and Argentinean (5.9%, a difference of 0.68%).
| Demographics | Rating | Rank | Professional Degree |
| Burmese | 100.0 /100 | #33 | Exceptional 6.1% |
| Mongolians | 100.0 /100 | #34 | Exceptional 6.1% |
| Immigrants | Korea | 100.0 /100 | #35 | Exceptional 6.1% |
| Immigrants | Russia | 100.0 /100 | #36 | Exceptional 6.0% |
| Immigrants | Austria | 100.0 /100 | #37 | Exceptional 6.0% |
| Immigrants | Norway | 100.0 /100 | #38 | Exceptional 6.0% |
| Immigrants | South Africa | 100.0 /100 | #39 | Exceptional 6.0% |
| Cambodians | 100.0 /100 | #40 | Exceptional 6.0% |
| New Zealanders | 100.0 /100 | #41 | Exceptional 6.0% |
| Estonians | 100.0 /100 | #42 | Exceptional 6.0% |
| Immigrants | Saudi Arabia | 100.0 /100 | #43 | Exceptional 5.9% |
| Argentineans | 100.0 /100 | #44 | Exceptional 5.9% |
| Immigrants | South Central Asia | 100.0 /100 | #45 | Exceptional 5.9% |
| Immigrants | Argentina | 100.0 /100 | #46 | Exceptional 5.9% |
| Australians | 100.0 /100 | #47 | Exceptional 5.9% |
Demographics Similar to Yakama by Professional Degree
In terms of professional degree, the demographic groups most similar to Yakama are Puget Sound Salish (3.1%, a difference of 0.030%), Kiowa (3.1%, a difference of 0.11%), Immigrants from Cabo Verde (3.1%, a difference of 0.23%), Bangladeshi (3.1%, a difference of 0.31%), and Creek (3.1%, a difference of 0.52%).
| Demographics | Rating | Rank | Professional Degree |
| Yaqui | 0.0 /100 | #325 | Tragic 3.2% |
| Menominee | 0.0 /100 | #326 | Tragic 3.1% |
| Dutch West Indians | 0.0 /100 | #327 | Tragic 3.1% |
| Creek | 0.0 /100 | #328 | Tragic 3.1% |
| Bangladeshis | 0.0 /100 | #329 | Tragic 3.1% |
| Immigrants | Cabo Verde | 0.0 /100 | #330 | Tragic 3.1% |
| Kiowa | 0.0 /100 | #331 | Tragic 3.1% |
| Yakama | 0.0 /100 | #332 | Tragic 3.1% |
| Puget Sound Salish | 0.0 /100 | #333 | Tragic 3.1% |
| Pennsylvania Germans | 0.0 /100 | #334 | Tragic 3.0% |
| Natives/Alaskans | 0.0 /100 | #335 | Tragic 3.0% |
| Fijians | 0.0 /100 | #336 | Tragic 2.9% |
| Arapaho | 0.0 /100 | #337 | Tragic 2.9% |
| Navajo | 0.0 /100 | #338 | Tragic 2.9% |
| Immigrants | Central America | 0.0 /100 | #339 | Tragic 2.9% |