Cambodian vs Osage Disability Age 18 to 34
COMPARE
Cambodian
Osage
Disability Age 18 to 34
Disability Age 18 to 34 Comparison
Cambodians
Osage
6.2%
DISABILITY AGE 18 TO 34
97.8/ 100
METRIC RATING
88th/ 347
METRIC RANK
8.3%
DISABILITY AGE 18 TO 34
0.0/ 100
METRIC RATING
330th/ 347
METRIC RANK
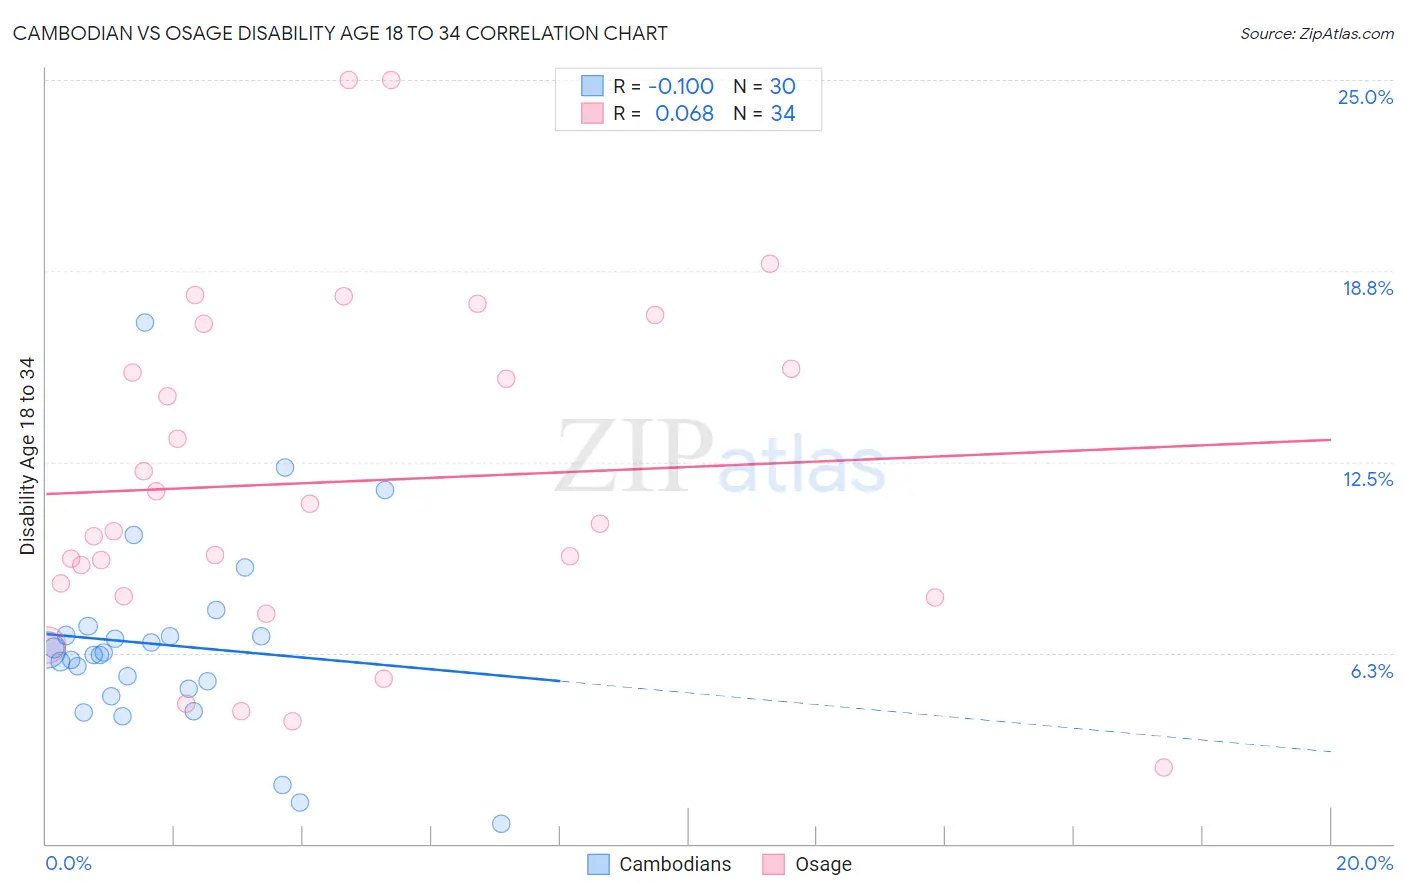
Cambodian vs Osage Disability Age 18 to 34 Correlation Chart
The statistical analysis conducted on geographies consisting of 102,463,205 people shows a slight negative correlation between the proportion of Cambodians and percentage of population with a disability between the ages 18 and 35 in the United States with a correlation coefficient (R) of -0.100 and weighted average of 6.2%. Similarly, the statistical analysis conducted on geographies consisting of 91,736,463 people shows a slight positive correlation between the proportion of Osage and percentage of population with a disability between the ages 18 and 35 in the United States with a correlation coefficient (R) of 0.068 and weighted average of 8.3%, a difference of 34.6%.
Disability Age 18 to 34 Correlation Summary
| Measurement | Cambodian | Osage |
| Minimum | 0.65% | 2.5% |
| Maximum | 17.1% | 25.0% |
| Range | 16.4% | 22.5% |
| Mean | 6.5% | 11.8% |
| Median | 6.2% | 10.4% |
| Interquartile 25% (IQ1) | 5.1% | 8.1% |
| Interquartile 75% (IQ3) | 6.8% | 15.6% |
| Interquartile Range (IQR) | 1.8% | 7.4% |
| Standard Deviation (Sample) | 3.2% | 5.6% |
| Standard Deviation (Population) | 3.2% | 5.5% |
Similar Demographics by Disability Age 18 to 34
Demographics Similar to Cambodians by Disability Age 18 to 34
In terms of disability age 18 to 34, the demographic groups most similar to Cambodians are Immigrants from Eastern Europe (6.2%, a difference of 0.030%), Turkish (6.2%, a difference of 0.060%), Immigrants from Vietnam (6.2%, a difference of 0.10%), Immigrants from Kuwait (6.2%, a difference of 0.11%), and Immigrants from Philippines (6.2%, a difference of 0.17%).
| Demographics | Rating | Rank | Disability Age 18 to 34 |
| Immigrants | Australia | 98.5 /100 | #81 | Exceptional 6.1% |
| Immigrants | Northern Africa | 98.4 /100 | #82 | Exceptional 6.1% |
| Barbadians | 98.3 /100 | #83 | Exceptional 6.1% |
| Israelis | 98.3 /100 | #84 | Exceptional 6.1% |
| Immigrants | Ireland | 98.2 /100 | #85 | Exceptional 6.1% |
| Immigrants | Kuwait | 98.0 /100 | #86 | Exceptional 6.2% |
| Immigrants | Eastern Europe | 97.9 /100 | #87 | Exceptional 6.2% |
| Cambodians | 97.8 /100 | #88 | Exceptional 6.2% |
| Turks | 97.8 /100 | #89 | Exceptional 6.2% |
| Immigrants | Vietnam | 97.7 /100 | #90 | Exceptional 6.2% |
| Immigrants | Philippines | 97.6 /100 | #91 | Exceptional 6.2% |
| Jordanians | 97.6 /100 | #92 | Exceptional 6.2% |
| Immigrants | Immigrants | 97.6 /100 | #93 | Exceptional 6.2% |
| Immigrants | Kazakhstan | 97.5 /100 | #94 | Exceptional 6.2% |
| Central Americans | 97.5 /100 | #95 | Exceptional 6.2% |
Demographics Similar to Osage by Disability Age 18 to 34
In terms of disability age 18 to 34, the demographic groups most similar to Osage are Comanche (8.3%, a difference of 0.18%), Crow (8.3%, a difference of 0.25%), Puget Sound Salish (8.3%, a difference of 0.40%), Delaware (8.2%, a difference of 0.78%), and Sioux (8.2%, a difference of 0.82%).
| Demographics | Rating | Rank | Disability Age 18 to 34 |
| French American Indians | 0.0 /100 | #323 | Tragic 8.2% |
| Cajuns | 0.0 /100 | #324 | Tragic 8.2% |
| Natives/Alaskans | 0.0 /100 | #325 | Tragic 8.2% |
| Potawatomi | 0.0 /100 | #326 | Tragic 8.2% |
| Sioux | 0.0 /100 | #327 | Tragic 8.2% |
| Delaware | 0.0 /100 | #328 | Tragic 8.2% |
| Crow | 0.0 /100 | #329 | Tragic 8.3% |
| Osage | 0.0 /100 | #330 | Tragic 8.3% |
| Comanche | 0.0 /100 | #331 | Tragic 8.3% |
| Puget Sound Salish | 0.0 /100 | #332 | Tragic 8.3% |
| Apache | 0.0 /100 | #333 | Tragic 8.4% |
| Dutch West Indians | 0.0 /100 | #334 | Tragic 8.4% |
| Seminole | 0.0 /100 | #335 | Tragic 8.4% |
| Immigrants | Azores | 0.0 /100 | #336 | Tragic 8.5% |
| Ottawa | 0.0 /100 | #337 | Tragic 8.6% |