Immigrants from Sweden vs Immigrants from Bangladesh 6th Grade
COMPARE
Immigrants from Sweden
Immigrants from Bangladesh
6th Grade
6th Grade Comparison
Immigrants from Sweden
Immigrants from Bangladesh
97.5%
6TH GRADE
98.6/ 100
METRIC RATING
97th/ 347
METRIC RANK
95.4%
6TH GRADE
0.0/ 100
METRIC RATING
315th/ 347
METRIC RANK
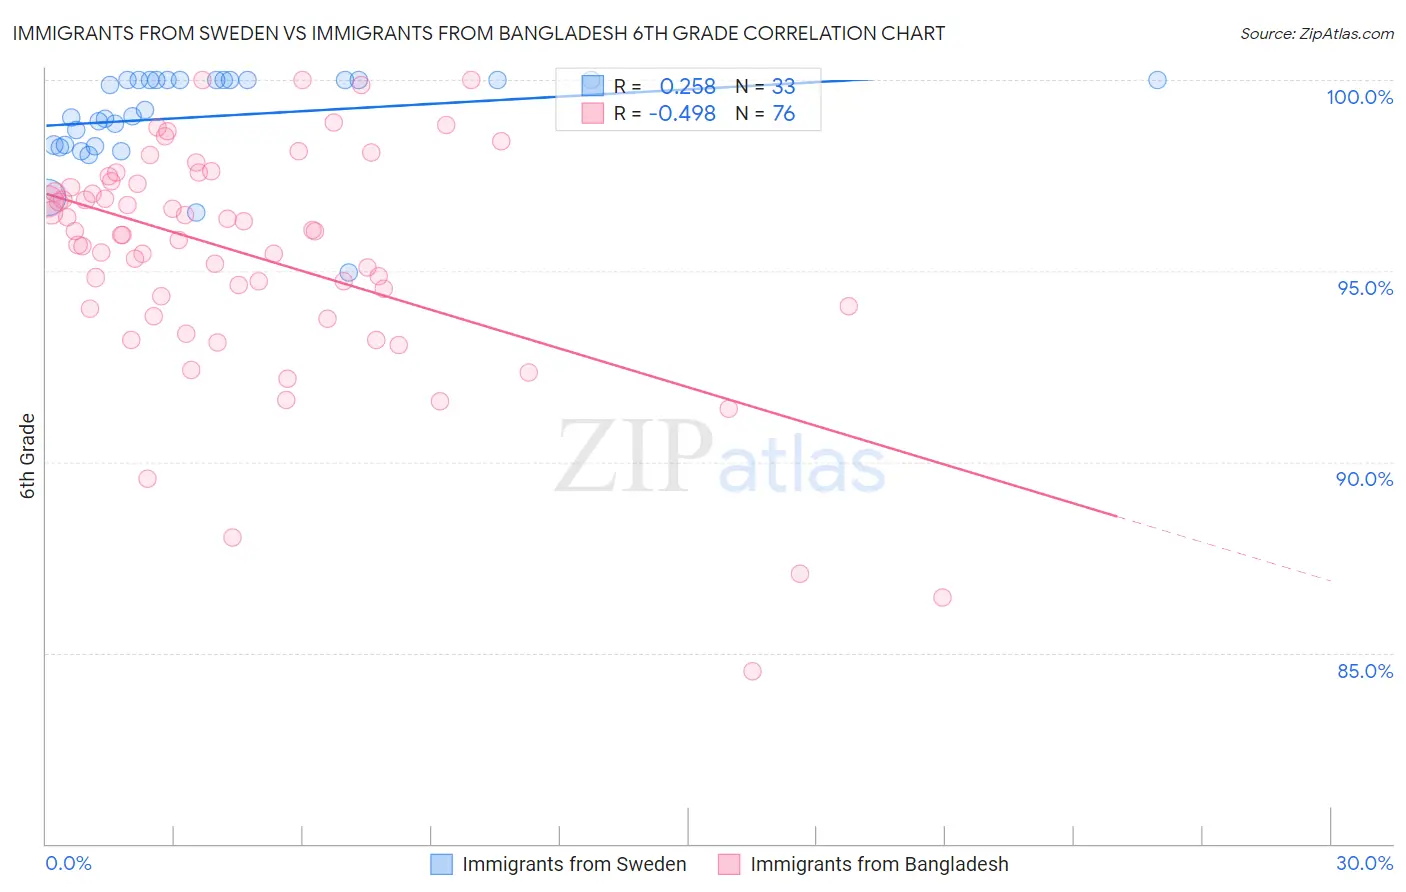
Immigrants from Sweden vs Immigrants from Bangladesh 6th Grade Correlation Chart
The statistical analysis conducted on geographies consisting of 164,737,092 people shows a weak positive correlation between the proportion of Immigrants from Sweden and percentage of population with at least 6th grade education in the United States with a correlation coefficient (R) of 0.258 and weighted average of 97.5%. Similarly, the statistical analysis conducted on geographies consisting of 203,672,706 people shows a moderate negative correlation between the proportion of Immigrants from Bangladesh and percentage of population with at least 6th grade education in the United States with a correlation coefficient (R) of -0.498 and weighted average of 95.4%, a difference of 2.3%.
6th Grade Correlation Summary
| Measurement | Immigrants from Sweden | Immigrants from Bangladesh |
| Minimum | 95.0% | 84.5% |
| Maximum | 100.0% | 100.0% |
| Range | 5.0% | 15.5% |
| Mean | 99.0% | 95.4% |
| Median | 99.2% | 96.0% |
| Interquartile 25% (IQ1) | 98.3% | 94.0% |
| Interquartile 75% (IQ3) | 100.0% | 97.3% |
| Interquartile Range (IQR) | 1.7% | 3.3% |
| Standard Deviation (Sample) | 1.2% | 3.1% |
| Standard Deviation (Population) | 1.2% | 3.0% |
Similar Demographics by 6th Grade
Demographics Similar to Immigrants from Sweden by 6th Grade
In terms of 6th grade, the demographic groups most similar to Immigrants from Sweden are Cree (97.5%, a difference of 0.0%), Cypriot (97.5%, a difference of 0.0%), Immigrants from Ireland (97.5%, a difference of 0.0%), Immigrants from Germany (97.5%, a difference of 0.0%), and Pueblo (97.5%, a difference of 0.010%).
| Demographics | Rating | Rank | 6th Grade |
| Pueblo | 98.8 /100 | #90 | Exceptional 97.5% |
| Immigrants | Western Europe | 98.8 /100 | #91 | Exceptional 97.5% |
| Romanians | 98.7 /100 | #92 | Exceptional 97.5% |
| Cree | 98.7 /100 | #93 | Exceptional 97.5% |
| Cypriots | 98.7 /100 | #94 | Exceptional 97.5% |
| Immigrants | Ireland | 98.7 /100 | #95 | Exceptional 97.5% |
| Immigrants | Germany | 98.6 /100 | #96 | Exceptional 97.5% |
| Immigrants | Sweden | 98.6 /100 | #97 | Exceptional 97.5% |
| Immigrants | Denmark | 98.5 /100 | #98 | Exceptional 97.5% |
| Yugoslavians | 98.5 /100 | #99 | Exceptional 97.5% |
| Turks | 98.3 /100 | #100 | Exceptional 97.5% |
| South Africans | 98.2 /100 | #101 | Exceptional 97.5% |
| Choctaw | 98.0 /100 | #102 | Exceptional 97.5% |
| Bhutanese | 98.0 /100 | #103 | Exceptional 97.5% |
| German Russians | 97.9 /100 | #104 | Exceptional 97.5% |
Demographics Similar to Immigrants from Bangladesh by 6th Grade
In terms of 6th grade, the demographic groups most similar to Immigrants from Bangladesh are Immigrants from Vietnam (95.4%, a difference of 0.010%), Japanese (95.4%, a difference of 0.010%), Nicaraguan (95.4%, a difference of 0.020%), Vietnamese (95.3%, a difference of 0.040%), and Belizean (95.3%, a difference of 0.070%).
| Demographics | Rating | Rank | 6th Grade |
| Immigrants | Caribbean | 0.0 /100 | #308 | Tragic 95.6% |
| Puerto Ricans | 0.0 /100 | #309 | Tragic 95.5% |
| Ecuadorians | 0.0 /100 | #310 | Tragic 95.5% |
| Immigrants | Portugal | 0.0 /100 | #311 | Tragic 95.5% |
| Immigrants | Guyana | 0.0 /100 | #312 | Tragic 95.5% |
| Nicaraguans | 0.0 /100 | #313 | Tragic 95.4% |
| Immigrants | Vietnam | 0.0 /100 | #314 | Tragic 95.4% |
| Immigrants | Bangladesh | 0.0 /100 | #315 | Tragic 95.4% |
| Japanese | 0.0 /100 | #316 | Tragic 95.4% |
| Vietnamese | 0.0 /100 | #317 | Tragic 95.3% |
| Belizeans | 0.0 /100 | #318 | Tragic 95.3% |
| Immigrants | Belize | 0.0 /100 | #319 | Tragic 95.3% |
| Immigrants | Ecuador | 0.0 /100 | #320 | Tragic 95.3% |
| Immigrants | Fiji | 0.0 /100 | #321 | Tragic 95.2% |
| Immigrants | Cambodia | 0.0 /100 | #322 | Tragic 95.2% |