Cambodian vs Immigrants from Dominica 8th Grade
COMPARE
Cambodian
Immigrants from Dominica
8th Grade
8th Grade Comparison
Cambodians
Immigrants from Dominica
96.1%
8TH GRADE
90.6/ 100
METRIC RATING
137th/ 347
METRIC RANK
94.0%
8TH GRADE
0.0/ 100
METRIC RATING
303rd/ 347
METRIC RANK
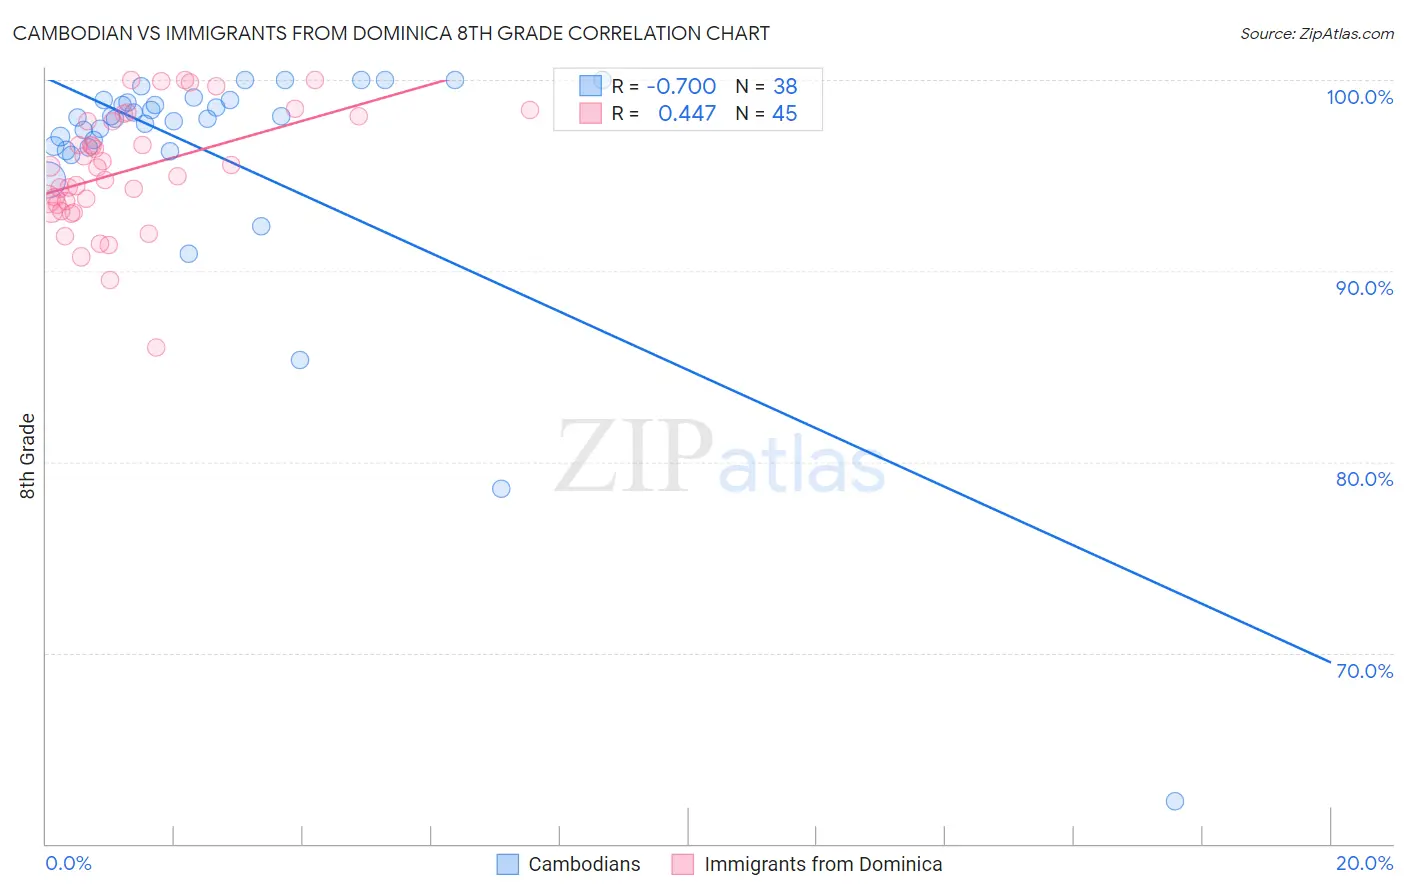
Cambodian vs Immigrants from Dominica 8th Grade Correlation Chart
The statistical analysis conducted on geographies consisting of 102,514,976 people shows a significant negative correlation between the proportion of Cambodians and percentage of population with at least 8th grade education in the United States with a correlation coefficient (R) of -0.700 and weighted average of 96.1%. Similarly, the statistical analysis conducted on geographies consisting of 83,794,115 people shows a moderate positive correlation between the proportion of Immigrants from Dominica and percentage of population with at least 8th grade education in the United States with a correlation coefficient (R) of 0.447 and weighted average of 94.0%, a difference of 2.3%.
8th Grade Correlation Summary
| Measurement | Cambodian | Immigrants from Dominica |
| Minimum | 62.2% | 86.0% |
| Maximum | 100.0% | 100.0% |
| Range | 37.8% | 14.0% |
| Mean | 96.0% | 95.3% |
| Median | 98.0% | 95.4% |
| Interquartile 25% (IQ1) | 96.5% | 93.3% |
| Interquartile 75% (IQ3) | 98.9% | 98.0% |
| Interquartile Range (IQR) | 2.5% | 4.7% |
| Standard Deviation (Sample) | 7.0% | 3.1% |
| Standard Deviation (Population) | 6.9% | 3.1% |
Similar Demographics by 8th Grade
Demographics Similar to Cambodians by 8th Grade
In terms of 8th grade, the demographic groups most similar to Cambodians are Jordanian (96.1%, a difference of 0.010%), Burmese (96.1%, a difference of 0.010%), Immigrants from Turkey (96.1%, a difference of 0.020%), Immigrants from Hungary (96.1%, a difference of 0.020%), and Basque (96.1%, a difference of 0.020%).
| Demographics | Rating | Rank | 8th Grade |
| Soviet Union | 92.6 /100 | #130 | Exceptional 96.1% |
| Pueblo | 92.3 /100 | #131 | Exceptional 96.1% |
| Immigrants | Kuwait | 92.2 /100 | #132 | Exceptional 96.1% |
| Immigrants | Turkey | 91.7 /100 | #133 | Exceptional 96.1% |
| Immigrants | Hungary | 91.5 /100 | #134 | Exceptional 96.1% |
| Basques | 91.5 /100 | #135 | Exceptional 96.1% |
| Jordanians | 91.3 /100 | #136 | Exceptional 96.1% |
| Cambodians | 90.6 /100 | #137 | Exceptional 96.1% |
| Burmese | 90.2 /100 | #138 | Exceptional 96.1% |
| Hmong | 89.7 /100 | #139 | Excellent 96.1% |
| Immigrants | South Central Asia | 89.4 /100 | #140 | Excellent 96.1% |
| Immigrants | Greece | 85.9 /100 | #141 | Excellent 96.0% |
| Immigrants | Eastern Europe | 85.4 /100 | #142 | Excellent 96.0% |
| Spanish | 85.1 /100 | #143 | Excellent 96.0% |
| Immigrants | Belarus | 84.8 /100 | #144 | Excellent 96.0% |
Demographics Similar to Immigrants from Dominica by 8th Grade
In terms of 8th grade, the demographic groups most similar to Immigrants from Dominica are Sri Lankan (94.0%, a difference of 0.040%), Guyanese (93.9%, a difference of 0.080%), Immigrants from Haiti (93.9%, a difference of 0.12%), Immigrants from Laos (94.1%, a difference of 0.14%), and Immigrants from Burma/Myanmar (94.1%, a difference of 0.16%).
| Demographics | Rating | Rank | 8th Grade |
| Haitians | 0.0 /100 | #296 | Tragic 94.2% |
| Immigrants | South Eastern Asia | 0.0 /100 | #297 | Tragic 94.2% |
| Indonesians | 0.0 /100 | #298 | Tragic 94.1% |
| Cubans | 0.0 /100 | #299 | Tragic 94.1% |
| Immigrants | Burma/Myanmar | 0.0 /100 | #300 | Tragic 94.1% |
| Immigrants | Laos | 0.0 /100 | #301 | Tragic 94.1% |
| Sri Lankans | 0.0 /100 | #302 | Tragic 94.0% |
| Immigrants | Dominica | 0.0 /100 | #303 | Tragic 94.0% |
| Guyanese | 0.0 /100 | #304 | Tragic 93.9% |
| Immigrants | Haiti | 0.0 /100 | #305 | Tragic 93.9% |
| Immigrants | Guyana | 0.0 /100 | #306 | Tragic 93.8% |
| Immigrants | Portugal | 0.0 /100 | #307 | Tragic 93.8% |
| Ecuadorians | 0.0 /100 | #308 | Tragic 93.6% |
| Immigrants | Immigrants | 0.0 /100 | #309 | Tragic 93.6% |
| Japanese | 0.0 /100 | #310 | Tragic 93.6% |