Laotian vs Immigrants from Thailand 8th Grade

COMPARE

Laotian
Race
Ancestry
AfghanAfricanAlaska NativeAlaskan AthabascanAlbanianAleutAlsatianAmericanApacheArabArapahoArgentineanArmenianAssyrian/Chaldean/SyriacAustralianAustrianBahamianBangladeshiBarbadianBasqueBelgianBelizeanBermudanBhutaneseBlackfeetBolivianBrazilianBritishBritish West IndianBulgarianBurmeseCajunCambodianCanadianCape VerdeanCarpatho RusynCelticCentral AmericanCentral American IndianCherokeeCheyenneChickasawChileanChineseChippewaChoctawColombianColvilleComancheCosta RicanCreeCreekCroatianCrowCubanCypriotCzechCzechoslovakianDanishDelawareDominicanDutchDutch West IndianEastern EuropeanEcuadorianEgyptianEnglishEstonianEthiopianEuropeanFijianFilipinoFinnishFrenchFrench American IndianFrench CanadianGermanGerman RussianGhanaianGreekGuamanian/ChamorroGuatemalanGuyaneseHaitianHmongHonduranHopiHoumaHungarianIcelanderIndian (Asian)IndonesianInupiatIranianIraqiIrishIroquoisIsraeliItalianJamaicanJapaneseJordanianKenyanKiowaKoreanLaotianLatvianLebaneseLiberianLithuanianLumbeeLuxembourgerMacedonianMalaysianMalteseMarshalleseMenomineeMexicanMexican American IndianMongolianMoroccanNative HawaiianNavajoNepaleseNew ZealanderNicaraguanNigerianNorthern EuropeanNorwegianOkinawanOsageOttawaPaiutePakistaniPalestinianPanamanianParaguayanPennsylvania GermanPeruvianPimaPolishPortuguesePotawatomiPuebloPuerto RicanPuget Sound SalishRomanianRussianSalvadoranSamoanScandinavianScotch-IrishScottishSeminoleSenegaleseSerbianShoshoneSierra LeoneanSiouxSlavicSlovakSloveneSomaliSouth AfricanSouth AmericanSouth American IndianSoviet UnionSpaniardSpanishSpanish AmericanSpanish American IndianSri LankanSubsaharan AfricanSudaneseSwedishSwissSyrianTaiwaneseThaiTlingit-HaidaTohono O'OdhamTonganTrinidadian and TobagonianTsimshianTurkishU.S. Virgin IslanderUgandanUkrainianUruguayanUteVenezuelanVietnameseWelshWest IndianYakamaYaquiYugoslavianYumanYup'ikZimbabwean
Immigration
NonimmigrantsImmigrantsAfghanistanAfricaAlbaniaArgentinaArmeniaAsiaAustraliaAustriaBahamasBangladeshBarbadosBelarusBelgiumBelizeBoliviaBosnia and HerzegovinaBrazilBulgariaBurma/MyanmarCabo VerdeCambodiaCameroonCanadaCaribbeanCentral AmericaChileChinaColombiaCongoCosta RicaCroatiaCubaCzechoslovakiaDenmarkDominicaDominican RepublicEastern AfricaEastern AsiaEastern EuropeEcuadorEgyptEl SalvadorEnglandEritreaEthiopiaEuropeFijiFranceGermanyGhanaGreeceGrenadaGuatemalaGuyanaHaitiHondurasHong KongHungaryIndiaIndonesiaIranIraqIrelandIsraelItalyJamaicaJapanJordanKazakhstanKenyaKoreaKuwaitLaosLatin AmericaLatviaLebanonLiberiaLithuaniaMalaysiaMexicoMicronesiaMiddle AfricaMoldovaMoroccoNepalNetherlandsNicaraguaNigeriaNorth AmericaNorth MacedoniaNorthern AfricaNorthern EuropeNorwayOceaniaPakistanPanamaPeruPhilippinesPolandPortugalRomaniaRussiaSaudi ArabiaScotlandSenegalSerbiaSierra LeoneSingaporeSomaliaSouth AfricaSouth AmericaSouth Central AsiaSouth Eastern AsiaSouthern EuropeSpainSri LankaSt. Vincent and the GrenadinesSudanSwedenSwitzerlandSyriaTaiwanTrinidad and TobagoTurkeyUgandaUkraineUruguayUzbekistanVenezuelaVietnamWest IndiesWestern AfricaWestern AsiaWestern EuropeYemenZaireZimbabweAzores
Immigrants from Thailand
Race
Ancestry
AfghanAfricanAlaska NativeAlaskan AthabascanAlbanianAleutAlsatianAmericanApacheArabArapahoArgentineanArmenianAssyrian/Chaldean/SyriacAustralianAustrianBahamianBangladeshiBarbadianBasqueBelgianBelizeanBermudanBhutaneseBlackfeetBolivianBrazilianBritishBritish West IndianBulgarianBurmeseCajunCambodianCanadianCape VerdeanCarpatho RusynCelticCentral AmericanCentral American IndianCherokeeCheyenneChickasawChileanChineseChippewaChoctawColombianColvilleComancheCosta RicanCreeCreekCroatianCrowCubanCypriotCzechCzechoslovakianDanishDelawareDominicanDutchDutch West IndianEastern EuropeanEcuadorianEgyptianEnglishEstonianEthiopianEuropeanFijianFilipinoFinnishFrenchFrench American IndianFrench CanadianGermanGerman RussianGhanaianGreekGuamanian/ChamorroGuatemalanGuyaneseHaitianHmongHonduranHopiHoumaHungarianIcelanderIndian (Asian)IndonesianInupiatIranianIraqiIrishIroquoisIsraeliItalianJamaicanJapaneseJordanianKenyanKiowaKoreanLatvianLebaneseLiberianLithuanianLumbeeLuxembourgerMacedonianMalaysianMalteseMarshalleseMenomineeMexicanMexican American IndianMongolianMoroccanNative HawaiianNavajoNepaleseNew ZealanderNicaraguanNigerianNorthern EuropeanNorwegianOkinawanOsageOttawaPaiutePakistaniPalestinianPanamanianParaguayanPennsylvania GermanPeruvianPimaPolishPortuguesePotawatomiPuebloPuerto RicanPuget Sound SalishRomanianRussianSalvadoranSamoanScandinavianScotch-IrishScottishSeminoleSenegaleseSerbianShoshoneSierra LeoneanSiouxSlavicSlovakSloveneSomaliSouth AfricanSouth AmericanSouth American IndianSoviet UnionSpaniardSpanishSpanish AmericanSpanish American IndianSri LankanSubsaharan AfricanSudaneseSwedishSwissSyrianTaiwaneseThaiTlingit-HaidaTohono O'OdhamTonganTrinidadian and TobagonianTsimshianTurkishU.S. Virgin IslanderUgandanUkrainianUruguayanUteVenezuelanVietnameseWelshWest IndianYakamaYaquiYugoslavianYumanYup'ikZimbabwean
Immigration
NonimmigrantsImmigrantsAfghanistanAfricaAlbaniaArgentinaArmeniaAsiaAustraliaAustriaBahamasBangladeshBarbadosBelarusBelgiumBelizeBoliviaBosnia and HerzegovinaBrazilBulgariaBurma/MyanmarCabo VerdeCambodiaCameroonCanadaCaribbeanCentral AmericaChileChinaColombiaCongoCosta RicaCroatiaCubaCzechoslovakiaDenmarkDominicaDominican RepublicEastern AfricaEastern AsiaEastern EuropeEcuadorEgyptEl SalvadorEnglandEritreaEthiopiaEuropeFijiFranceGermanyGhanaGreeceGrenadaGuatemalaGuyanaHaitiHondurasHong KongHungaryIndiaIndonesiaIranIraqIrelandIsraelItalyJamaicaJapanJordanKazakhstanKenyaKoreaKuwaitLaosLatin AmericaLatviaLebanonLiberiaLithuaniaMalaysiaMexicoMicronesiaMiddle AfricaMoldovaMoroccoNepalNetherlandsNicaraguaNigeriaNorth AmericaNorth MacedoniaNorthern AfricaNorthern EuropeNorwayOceaniaPakistanPanamaPeruPhilippinesPolandPortugalRomaniaRussiaSaudi ArabiaScotlandSenegalSerbiaSierra LeoneSingaporeSomaliaSouth AfricaSouth AmericaSouth Central AsiaSouth Eastern AsiaSouthern EuropeSpainSri LankaSt. Vincent and the GrenadinesSudanSwedenSwitzerlandSyriaTaiwanThailandTrinidad and TobagoTurkeyUgandaUkraineUruguayUzbekistanVenezuelaVietnamWest IndiesWestern AfricaWestern AsiaWestern EuropeYemenZaireZimbabweAzores
8th Grade
Income
Poverty
Unemployment
Labor Participation
Family Structure
Vehicle Availability
Education Level
Disability

8th Grade Comparison

Laotians

Immigrants from Thailand

Tragic
Tragic
95.4%
8TH GRADE
9.0/ 100
METRIC RATING
213th/ 347
METRIC RANK
94.8%
8TH GRADE
0.2/ 100
METRIC RATING
269th/ 347
METRIC RANK

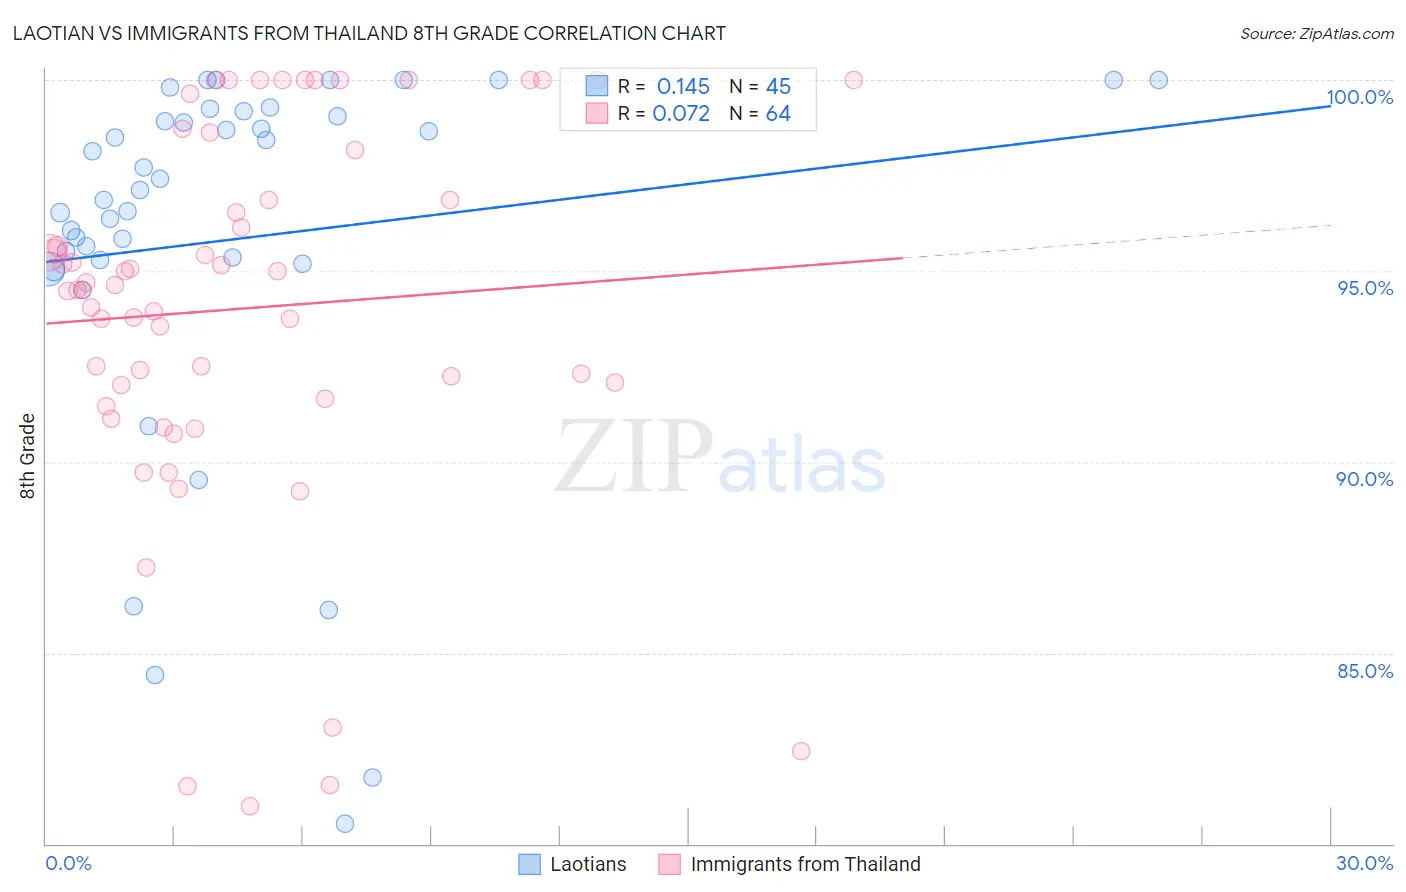
Laotian vs Immigrants from Thailand 8th Grade Correlation Chart

The statistical analysis conducted on geographies consisting of 224,856,886 people shows a poor positive correlation between the proportion of Laotians and percentage of population with at least 8th grade education in the United States with a correlation coefficient (R) of 0.145 and weighted average of 95.4%. Similarly, the statistical analysis conducted on geographies consisting of 317,022,868 people shows a slight positive correlation between the proportion of Immigrants from Thailand and percentage of population with at least 8th grade education in the United States with a correlation coefficient (R) of 0.072 and weighted average of 94.8%, a difference of 0.61%.
Laotian vs Immigrants from Thailand 8th Grade

8th Grade Correlation Summary

MeasurementLaotianImmigrants from Thailand
Minimum80.5%81.0%
Maximum100.0%100.0%
Range19.5%19.0%
Mean95.8%94.0%
Median97.1%94.6%
Interquartile 25% (IQ1)95.2%91.8%
Interquartile 75% (IQ3)99.1%97.5%
Interquartile Range (IQR)3.9%5.7%
Standard Deviation (Sample)4.9%4.9%
Standard Deviation (Population)4.9%4.8%

Similar Demographics by 8th Grade

Demographics Similar to Laotians by 8th Grade

In terms of 8th grade, the demographic groups most similar to Laotians are Immigrants from Chile (95.4%, a difference of 0.0%), Immigrants from Liberia (95.4%, a difference of 0.0%), Immigrants from Pakistan (95.4%, a difference of 0.010%), Samoan (95.4%, a difference of 0.010%), and Immigrants from Eastern Asia (95.4%, a difference of 0.020%).
DemographicsRating | Rank8th Grade
Comanche
16.3
/100
|
#206
Poor
95.5%
Immigrants | Sudan
15.1
/100
|
#207
Poor
95.5%
Portuguese
14.3
/100
|
#208
Poor
95.5%
Immigrants | Lebanon
13.7
/100
|
#209
Poor
95.4%
Africans
13.6
/100
|
#210
Poor
95.4%
Immigrants | Morocco
12.4
/100
|
#211
Poor
95.4%
Immigrants | Pakistan
9.7
/100
|
#212
Tragic
95.4%
Laotians
9.0
/100
|
#213
Tragic
95.4%
Immigrants | Chile
9.0
/100
|
#214
Tragic
95.4%
Immigrants | Liberia
8.9
/100
|
#215
Tragic
95.4%
Samoans
8.4
/100
|
#216
Tragic
95.4%
Immigrants | Eastern Asia
8.3
/100
|
#217
Tragic
95.4%
Dutch West Indians
8.1
/100
|
#218
Tragic
95.4%
Spanish Americans
8.0
/100
|
#219
Tragic
95.4%
Immigrants | Southern Europe
7.7
/100
|
#220
Tragic
95.3%

Demographics Similar to Immigrants from Thailand by 8th Grade

In terms of 8th grade, the demographic groups most similar to Immigrants from Thailand are Immigrants from Ghana (94.8%, a difference of 0.020%), Immigrants from Uruguay (94.8%, a difference of 0.020%), Immigrants from Uzbekistan (94.8%, a difference of 0.020%), Immigrants from Afghanistan (94.8%, a difference of 0.020%), and West Indian (94.8%, a difference of 0.040%).
DemographicsRating | Rank8th Grade
Immigrants | Nigeria
0.4
/100
|
#262
Tragic
94.9%
Immigrants | Hong Kong
0.4
/100
|
#263
Tragic
94.9%
South Americans
0.4
/100
|
#264
Tragic
94.9%
Yuman
0.4
/100
|
#265
Tragic
94.9%
West Indians
0.3
/100
|
#266
Tragic
94.8%
Immigrants | Ghana
0.3
/100
|
#267
Tragic
94.8%
Immigrants | Uruguay
0.3
/100
|
#268
Tragic
94.8%
Immigrants | Thailand
0.2
/100
|
#269
Tragic
94.8%
Immigrants | Uzbekistan
0.2
/100
|
#270
Tragic
94.8%
Immigrants | Afghanistan
0.2
/100
|
#271
Tragic
94.8%
Immigrants | South America
0.2
/100
|
#272
Tragic
94.8%
Immigrants | Western Africa
0.2
/100
|
#273
Tragic
94.8%
Trinidadians and Tobagonians
0.2
/100
|
#274
Tragic
94.7%
Immigrants | Colombia
0.2
/100
|
#275
Tragic
94.7%
Peruvians
0.1
/100
|
#276
Tragic
94.7%