Dutch vs Immigrants from Netherlands 9th Grade
COMPARE
Dutch
Immigrants from Netherlands
9th Grade
9th Grade Comparison
Dutch
Immigrants from Netherlands
96.5%
9TH GRADE
100.0/ 100
METRIC RATING
17th/ 347
METRIC RANK
95.8%
9TH GRADE
99.6/ 100
METRIC RATING
66th/ 347
METRIC RANK
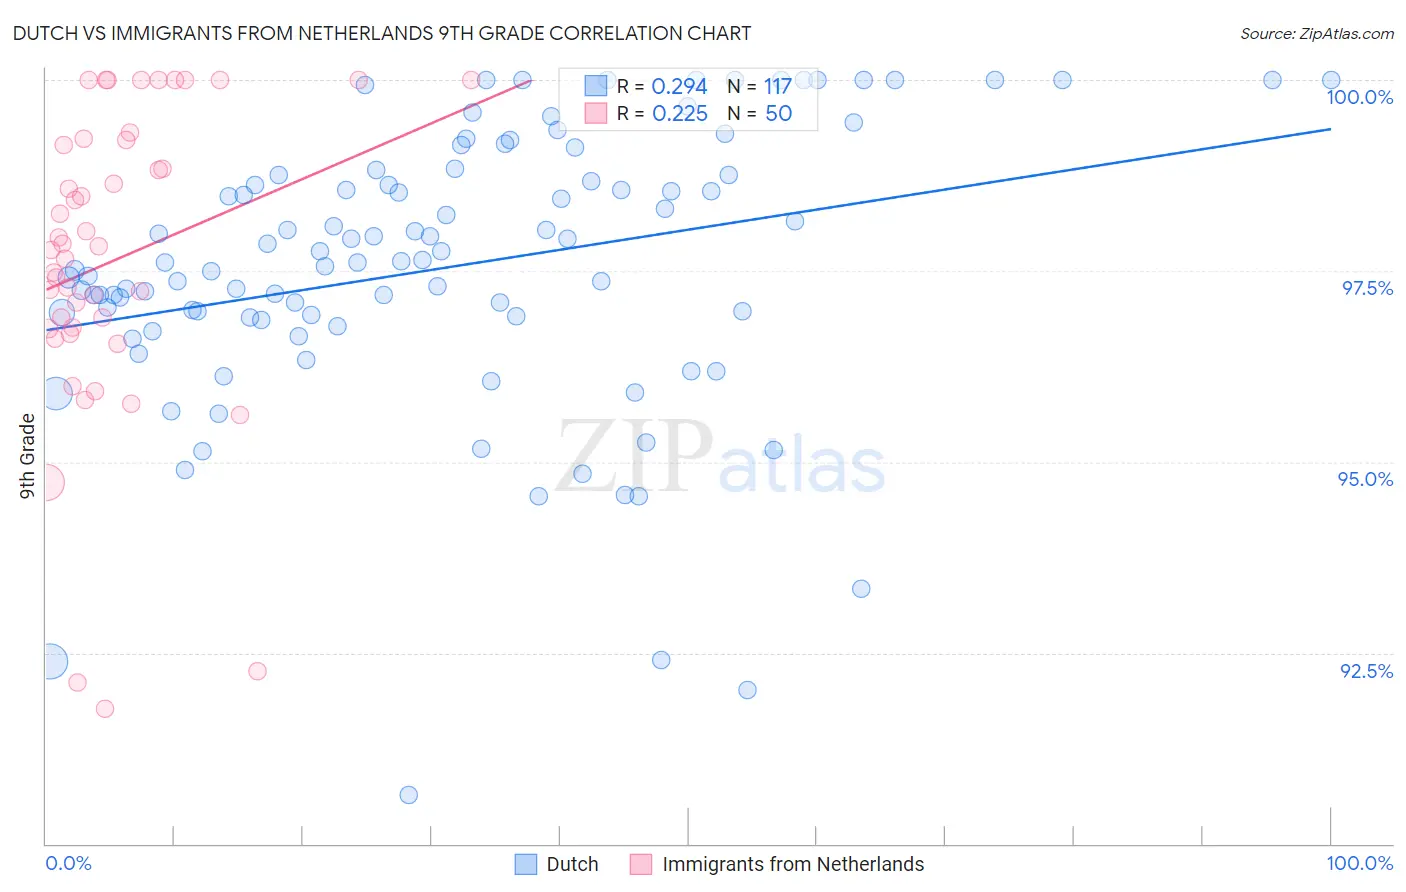
Dutch vs Immigrants from Netherlands 9th Grade Correlation Chart
The statistical analysis conducted on geographies consisting of 554,359,196 people shows a weak positive correlation between the proportion of Dutch and percentage of population with at least 9th grade education in the United States with a correlation coefficient (R) of 0.294 and weighted average of 96.5%. Similarly, the statistical analysis conducted on geographies consisting of 237,869,934 people shows a weak positive correlation between the proportion of Immigrants from Netherlands and percentage of population with at least 9th grade education in the United States with a correlation coefficient (R) of 0.225 and weighted average of 95.8%, a difference of 0.66%.
9th Grade Correlation Summary
| Measurement | Dutch | Immigrants from Netherlands |
| Minimum | 90.6% | 91.8% |
| Maximum | 100.0% | 100.0% |
| Range | 9.4% | 8.2% |
| Mean | 97.5% | 97.6% |
| Median | 97.6% | 97.8% |
| Interquartile 25% (IQ1) | 96.9% | 96.7% |
| Interquartile 75% (IQ3) | 98.8% | 99.2% |
| Interquartile Range (IQR) | 1.9% | 2.5% |
| Standard Deviation (Sample) | 1.8% | 2.0% |
| Standard Deviation (Population) | 1.8% | 2.0% |
Similar Demographics by 9th Grade
Demographics Similar to Dutch by 9th Grade
In terms of 9th grade, the demographic groups most similar to Dutch are Scandinavian (96.5%, a difference of 0.020%), Welsh (96.4%, a difference of 0.050%), Irish (96.5%, a difference of 0.060%), Croatian (96.5%, a difference of 0.060%), and Italian (96.4%, a difference of 0.060%).
| Demographics | Rating | Rank | 9th Grade |
| Lithuanians | 100.0 /100 | #10 | Exceptional 96.6% |
| Finns | 100.0 /100 | #11 | Exceptional 96.6% |
| English | 100.0 /100 | #12 | Exceptional 96.6% |
| Danes | 100.0 /100 | #13 | Exceptional 96.5% |
| Scottish | 100.0 /100 | #14 | Exceptional 96.5% |
| Irish | 100.0 /100 | #15 | Exceptional 96.5% |
| Croatians | 100.0 /100 | #16 | Exceptional 96.5% |
| Dutch | 100.0 /100 | #17 | Exceptional 96.5% |
| Scandinavians | 100.0 /100 | #18 | Exceptional 96.5% |
| Welsh | 100.0 /100 | #19 | Exceptional 96.4% |
| Italians | 100.0 /100 | #20 | Exceptional 96.4% |
| Alaskan Athabascans | 100.0 /100 | #21 | Exceptional 96.4% |
| Europeans | 100.0 /100 | #22 | Exceptional 96.4% |
| Czechs | 100.0 /100 | #23 | Exceptional 96.4% |
| Latvians | 100.0 /100 | #24 | Exceptional 96.4% |
Demographics Similar to Immigrants from Netherlands by 9th Grade
In terms of 9th grade, the demographic groups most similar to Immigrants from Netherlands are Cypriot (95.8%, a difference of 0.010%), Immigrants from Ireland (95.8%, a difference of 0.010%), Immigrants from Lithuania (95.8%, a difference of 0.010%), Immigrants from England (95.9%, a difference of 0.020%), and Zimbabwean (95.9%, a difference of 0.030%).
| Demographics | Rating | Rank | 9th Grade |
| New Zealanders | 99.8 /100 | #59 | Exceptional 95.9% |
| Native Hawaiians | 99.8 /100 | #60 | Exceptional 95.9% |
| Sioux | 99.8 /100 | #61 | Exceptional 95.9% |
| Ukrainians | 99.7 /100 | #62 | Exceptional 95.9% |
| Canadians | 99.7 /100 | #63 | Exceptional 95.9% |
| Zimbabweans | 99.7 /100 | #64 | Exceptional 95.9% |
| Immigrants | England | 99.6 /100 | #65 | Exceptional 95.9% |
| Immigrants | Netherlands | 99.6 /100 | #66 | Exceptional 95.8% |
| Cypriots | 99.6 /100 | #67 | Exceptional 95.8% |
| Immigrants | Ireland | 99.6 /100 | #68 | Exceptional 95.8% |
| Immigrants | Lithuania | 99.6 /100 | #69 | Exceptional 95.8% |
| Immigrants | Australia | 99.5 /100 | #70 | Exceptional 95.8% |
| Immigrants | Belgium | 99.5 /100 | #71 | Exceptional 95.8% |
| Turks | 99.5 /100 | #72 | Exceptional 95.8% |
| Immigrants | Singapore | 99.5 /100 | #73 | Exceptional 95.8% |