Immigrants from Pakistan vs Immigrants from Barbados Master's Degree
COMPARE
Immigrants from Pakistan
Immigrants from Barbados
Master's Degree
Master's Degree Comparison
Immigrants from Pakistan
Immigrants from Barbados
17.8%
MASTER'S DEGREE
99.7/ 100
METRIC RATING
71st/ 347
METRIC RANK
14.3%
MASTER'S DEGREE
20.5/ 100
METRIC RATING
208th/ 347
METRIC RANK
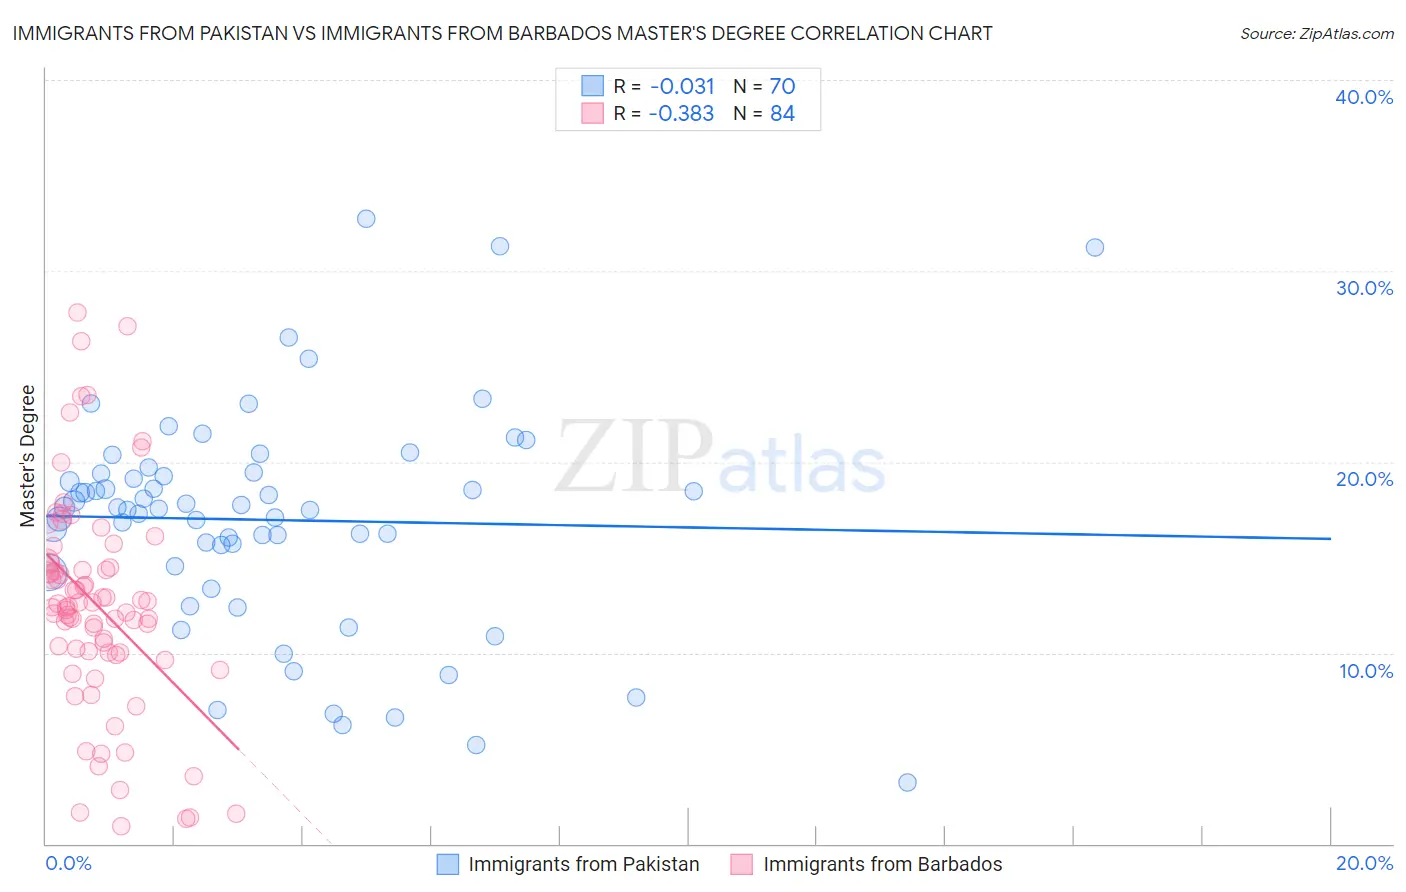
Immigrants from Pakistan vs Immigrants from Barbados Master's Degree Correlation Chart
The statistical analysis conducted on geographies consisting of 283,872,372 people shows no correlation between the proportion of Immigrants from Pakistan and percentage of population with at least master's degree education in the United States with a correlation coefficient (R) of -0.031 and weighted average of 17.8%. Similarly, the statistical analysis conducted on geographies consisting of 112,776,866 people shows a mild negative correlation between the proportion of Immigrants from Barbados and percentage of population with at least master's degree education in the United States with a correlation coefficient (R) of -0.383 and weighted average of 14.3%, a difference of 24.5%.
Master's Degree Correlation Summary
| Measurement | Immigrants from Pakistan | Immigrants from Barbados |
| Minimum | 3.2% | 0.92% |
| Maximum | 32.7% | 27.8% |
| Range | 29.5% | 26.9% |
| Mean | 17.0% | 12.5% |
| Median | 17.6% | 12.4% |
| Interquartile 25% (IQ1) | 14.5% | 10.0% |
| Interquartile 75% (IQ3) | 19.4% | 14.6% |
| Interquartile Range (IQR) | 4.9% | 4.6% |
| Standard Deviation (Sample) | 5.8% | 5.7% |
| Standard Deviation (Population) | 5.7% | 5.6% |
Similar Demographics by Master's Degree
Demographics Similar to Immigrants from Pakistan by Master's Degree
In terms of master's degree, the demographic groups most similar to Immigrants from Pakistan are Lithuanian (17.7%, a difference of 0.17%), Immigrants from Western Europe (17.8%, a difference of 0.28%), Zimbabwean (17.7%, a difference of 0.28%), Immigrants from Uzbekistan (17.9%, a difference of 0.50%), and Immigrants from Romania (17.7%, a difference of 0.59%).
| Demographics | Rating | Rank | Master's Degree |
| South Africans | 99.9 /100 | #64 | Exceptional 18.1% |
| Immigrants | Kazakhstan | 99.8 /100 | #65 | Exceptional 18.0% |
| Ethiopians | 99.8 /100 | #66 | Exceptional 18.0% |
| Immigrants | Argentina | 99.8 /100 | #67 | Exceptional 18.0% |
| Immigrants | Ethiopia | 99.8 /100 | #68 | Exceptional 17.9% |
| Immigrants | Uzbekistan | 99.8 /100 | #69 | Exceptional 17.9% |
| Immigrants | Western Europe | 99.8 /100 | #70 | Exceptional 17.8% |
| Immigrants | Pakistan | 99.7 /100 | #71 | Exceptional 17.8% |
| Lithuanians | 99.7 /100 | #72 | Exceptional 17.7% |
| Zimbabweans | 99.7 /100 | #73 | Exceptional 17.7% |
| Immigrants | Romania | 99.7 /100 | #74 | Exceptional 17.7% |
| Egyptians | 99.6 /100 | #75 | Exceptional 17.6% |
| Immigrants | Indonesia | 99.6 /100 | #76 | Exceptional 17.6% |
| Immigrants | Eastern Europe | 99.6 /100 | #77 | Exceptional 17.6% |
| Immigrants | Hungary | 99.6 /100 | #78 | Exceptional 17.5% |
Demographics Similar to Immigrants from Barbados by Master's Degree
In terms of master's degree, the demographic groups most similar to Immigrants from Barbados are Immigrants from Panama (14.3%, a difference of 0.090%), Subsaharan African (14.2%, a difference of 0.22%), Immigrants from Bosnia and Herzegovina (14.3%, a difference of 0.30%), Somali (14.2%, a difference of 0.53%), and Scandinavian (14.4%, a difference of 0.55%).
| Demographics | Rating | Rank | Master's Degree |
| Scotch-Irish | 25.0 /100 | #201 | Fair 14.4% |
| Immigrants | Western Africa | 24.9 /100 | #202 | Fair 14.4% |
| Yugoslavians | 24.3 /100 | #203 | Fair 14.4% |
| French | 23.7 /100 | #204 | Fair 14.4% |
| Trinidadians and Tobagonians | 23.5 /100 | #205 | Fair 14.4% |
| Scandinavians | 23.3 /100 | #206 | Fair 14.4% |
| Immigrants | Bosnia and Herzegovina | 22.0 /100 | #207 | Fair 14.3% |
| Immigrants | Barbados | 20.5 /100 | #208 | Fair 14.3% |
| Immigrants | Panama | 20.0 /100 | #209 | Fair 14.3% |
| Sub-Saharan Africans | 19.4 /100 | #210 | Poor 14.2% |
| Somalis | 18.0 /100 | #211 | Poor 14.2% |
| Spanish | 17.8 /100 | #212 | Poor 14.2% |
| Immigrants | Thailand | 17.0 /100 | #213 | Poor 14.2% |
| Finns | 16.9 /100 | #214 | Poor 14.2% |
| Immigrants | Vietnam | 16.1 /100 | #215 | Poor 14.1% |