British West Indian vs Somali Unemployment Among Ages 65 to 74 years
COMPARE
British West Indian
Somali
Unemployment Among Ages 65 to 74 years
Unemployment Among Ages 65 to 74 years Comparison
British West Indians
Somalis
5.8%
UNEMPLOYMENT AMONG AGES 65 TO 74 YEARS
0.0/ 100
METRIC RATING
307th/ 347
METRIC RANK
5.7%
UNEMPLOYMENT AMONG AGES 65 TO 74 YEARS
0.1/ 100
METRIC RATING
276th/ 347
METRIC RANK
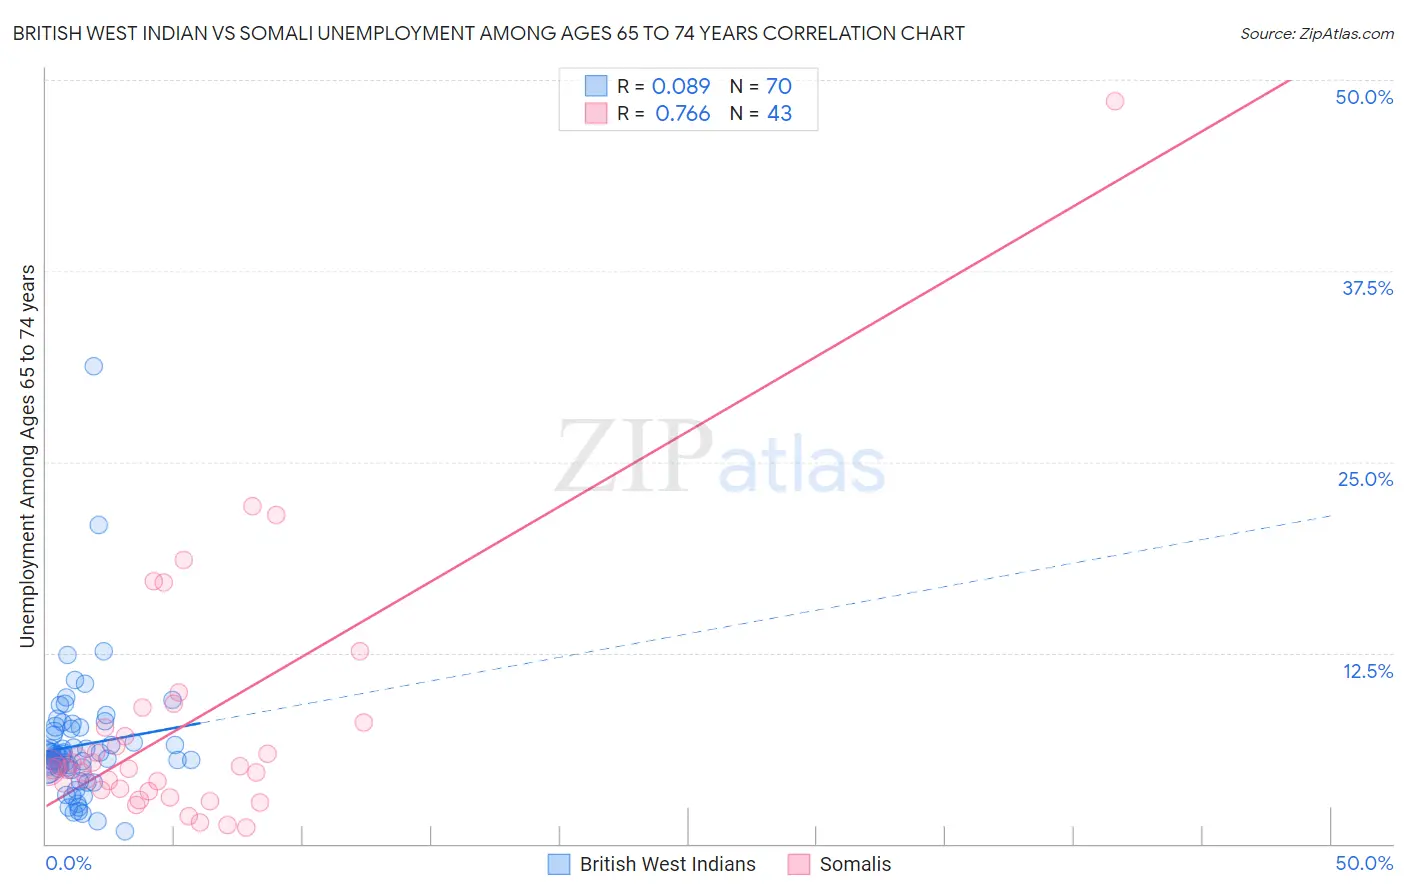
British West Indian vs Somali Unemployment Among Ages 65 to 74 years Correlation Chart
The statistical analysis conducted on geographies consisting of 144,276,982 people shows a slight positive correlation between the proportion of British West Indians and unemployment rate among population between the ages 65 and 74 in the United States with a correlation coefficient (R) of 0.089 and weighted average of 5.8%. Similarly, the statistical analysis conducted on geographies consisting of 94,117,477 people shows a strong positive correlation between the proportion of Somalis and unemployment rate among population between the ages 65 and 74 in the United States with a correlation coefficient (R) of 0.766 and weighted average of 5.7%, a difference of 2.9%.
Unemployment Among Ages 65 to 74 years Correlation Summary
| Measurement | British West Indian | Somali |
| Minimum | 0.80% | 1.1% |
| Maximum | 31.3% | 48.6% |
| Range | 30.5% | 47.5% |
| Mean | 6.4% | 7.6% |
| Median | 5.8% | 5.0% |
| Interquartile 25% (IQ1) | 5.0% | 3.5% |
| Interquartile 75% (IQ3) | 7.5% | 7.9% |
| Interquartile Range (IQR) | 2.6% | 4.4% |
| Standard Deviation (Sample) | 4.2% | 8.3% |
| Standard Deviation (Population) | 4.2% | 8.2% |
Similar Demographics by Unemployment Among Ages 65 to 74 years
Demographics Similar to British West Indians by Unemployment Among Ages 65 to 74 years
In terms of unemployment among ages 65 to 74 years, the demographic groups most similar to British West Indians are Cheyenne (5.8%, a difference of 0.0%), Mexican (5.8%, a difference of 0.010%), Arapaho (5.8%, a difference of 0.020%), Salvadoran (5.8%, a difference of 0.020%), and Liberian (5.8%, a difference of 0.050%).
| Demographics | Rating | Rank | Unemployment Among Ages 65 to 74 years |
| Ecuadorians | 0.0 /100 | #300 | Tragic 5.8% |
| Armenians | 0.0 /100 | #301 | Tragic 5.8% |
| Liberians | 0.0 /100 | #302 | Tragic 5.8% |
| Arapaho | 0.0 /100 | #303 | Tragic 5.8% |
| Salvadorans | 0.0 /100 | #304 | Tragic 5.8% |
| Mexicans | 0.0 /100 | #305 | Tragic 5.8% |
| Cheyenne | 0.0 /100 | #306 | Tragic 5.8% |
| British West Indians | 0.0 /100 | #307 | Tragic 5.8% |
| Guatemalans | 0.0 /100 | #308 | Tragic 5.8% |
| Immigrants | Ecuador | 0.0 /100 | #309 | Tragic 5.8% |
| Immigrants | Bangladesh | 0.0 /100 | #310 | Tragic 5.9% |
| Venezuelans | 0.0 /100 | #311 | Tragic 5.9% |
| Hispanics or Latinos | 0.0 /100 | #312 | Tragic 5.9% |
| Vietnamese | 0.0 /100 | #313 | Tragic 5.9% |
| Immigrants | Venezuela | 0.0 /100 | #314 | Tragic 5.9% |
Demographics Similar to Somalis by Unemployment Among Ages 65 to 74 years
In terms of unemployment among ages 65 to 74 years, the demographic groups most similar to Somalis are Immigrants from Liberia (5.7%, a difference of 0.050%), Immigrants from Guyana (5.7%, a difference of 0.090%), Bahamian (5.7%, a difference of 0.11%), Yaqui (5.7%, a difference of 0.13%), and Belizean (5.7%, a difference of 0.15%).
| Demographics | Rating | Rank | Unemployment Among Ages 65 to 74 years |
| Immigrants | Colombia | 0.1 /100 | #269 | Tragic 5.7% |
| Immigrants | Nigeria | 0.1 /100 | #270 | Tragic 5.7% |
| Belizeans | 0.1 /100 | #271 | Tragic 5.7% |
| Yaqui | 0.1 /100 | #272 | Tragic 5.7% |
| Bahamians | 0.1 /100 | #273 | Tragic 5.7% |
| Immigrants | Guyana | 0.1 /100 | #274 | Tragic 5.7% |
| Immigrants | Liberia | 0.1 /100 | #275 | Tragic 5.7% |
| Somalis | 0.1 /100 | #276 | Tragic 5.7% |
| Immigrants | South America | 0.1 /100 | #277 | Tragic 5.7% |
| Mexican American Indians | 0.1 /100 | #278 | Tragic 5.7% |
| Immigrants | Norway | 0.1 /100 | #279 | Tragic 5.7% |
| Moroccans | 0.1 /100 | #280 | Tragic 5.7% |
| Immigrants | West Indies | 0.1 /100 | #281 | Tragic 5.7% |
| Ottawa | 0.1 /100 | #282 | Tragic 5.7% |
| Cypriots | 0.1 /100 | #283 | Tragic 5.7% |