British West Indian vs Shoshone 2nd Grade
COMPARE
British West Indian
Shoshone
2nd Grade
2nd Grade Comparison
British West Indians
Shoshone
97.2%
2ND GRADE
0.0/ 100
METRIC RATING
293rd/ 347
METRIC RANK
98.3%
2ND GRADE
99.4/ 100
METRIC RATING
75th/ 347
METRIC RANK
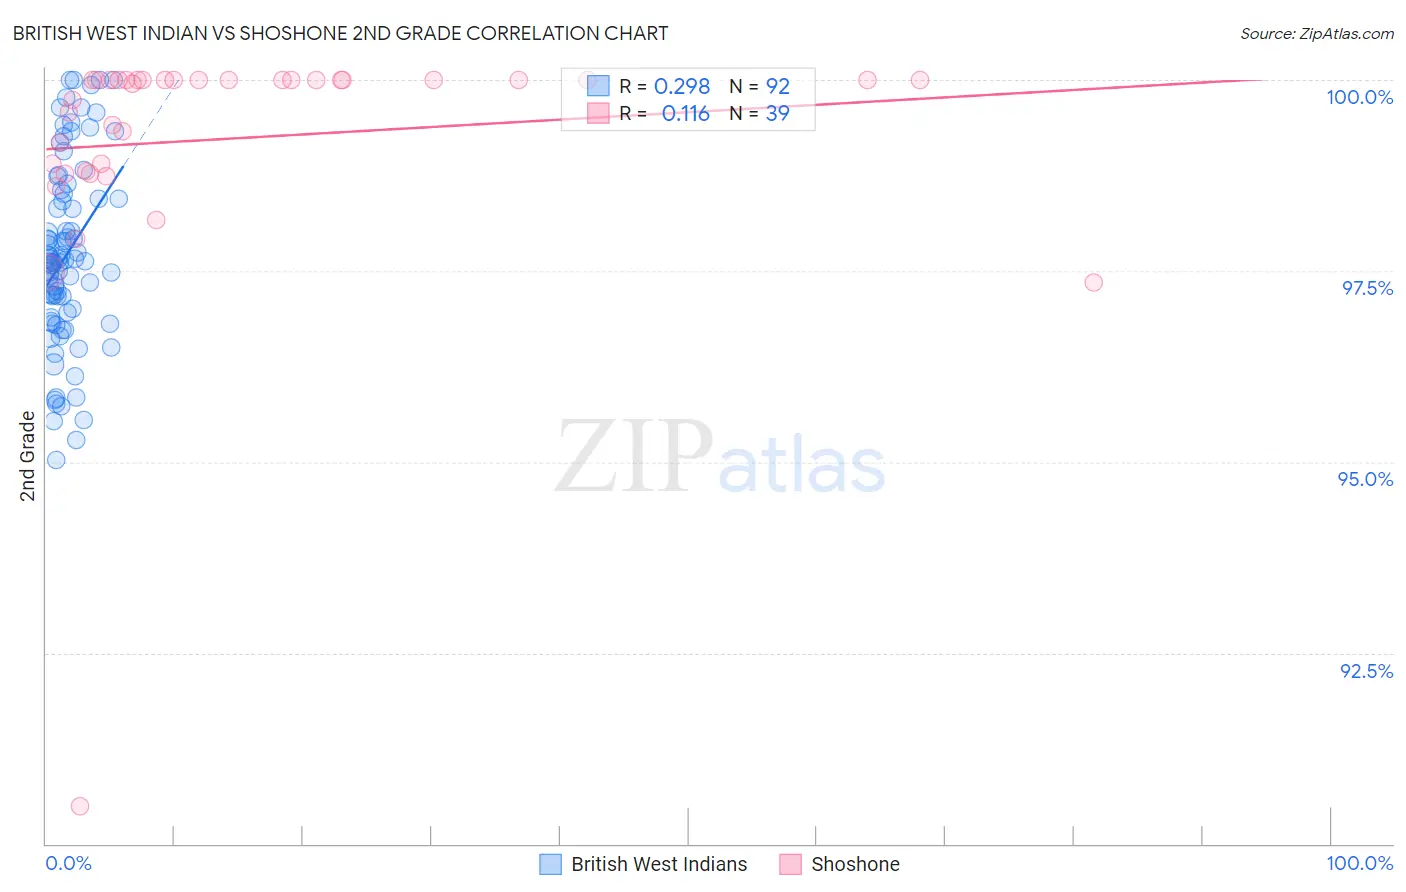
British West Indian vs Shoshone 2nd Grade Correlation Chart
The statistical analysis conducted on geographies consisting of 152,691,173 people shows a weak positive correlation between the proportion of British West Indians and percentage of population with at least 2nd grade education in the United States with a correlation coefficient (R) of 0.298 and weighted average of 97.2%. Similarly, the statistical analysis conducted on geographies consisting of 66,625,086 people shows a poor positive correlation between the proportion of Shoshone and percentage of population with at least 2nd grade education in the United States with a correlation coefficient (R) of 0.116 and weighted average of 98.3%, a difference of 1.1%.
2nd Grade Correlation Summary
| Measurement | British West Indian | Shoshone |
| Minimum | 95.0% | 90.5% |
| Maximum | 100.0% | 100.0% |
| Range | 5.0% | 9.5% |
| Mean | 97.7% | 99.2% |
| Median | 97.6% | 100.0% |
| Interquartile 25% (IQ1) | 96.9% | 98.8% |
| Interquartile 75% (IQ3) | 98.5% | 100.0% |
| Interquartile Range (IQR) | 1.6% | 1.2% |
| Standard Deviation (Sample) | 1.2% | 1.6% |
| Standard Deviation (Population) | 1.2% | 1.6% |
Similar Demographics by 2nd Grade
Demographics Similar to British West Indians by 2nd Grade
In terms of 2nd grade, the demographic groups most similar to British West Indians are Immigrants from Eritrea (97.2%, a difference of 0.010%), Malaysian (97.1%, a difference of 0.020%), Houma (97.2%, a difference of 0.040%), Immigrants from St. Vincent and the Grenadines (97.2%, a difference of 0.040%), and Immigrants from Afghanistan (97.2%, a difference of 0.040%).
| Demographics | Rating | Rank | 2nd Grade |
| Immigrants | Barbados | 0.0 /100 | #286 | Tragic 97.2% |
| Immigrants | Portugal | 0.0 /100 | #287 | Tragic 97.2% |
| Immigrants | Thailand | 0.0 /100 | #288 | Tragic 97.2% |
| Houma | 0.0 /100 | #289 | Tragic 97.2% |
| Immigrants | St. Vincent and the Grenadines | 0.0 /100 | #290 | Tragic 97.2% |
| Immigrants | Afghanistan | 0.0 /100 | #291 | Tragic 97.2% |
| Immigrants | Eritrea | 0.0 /100 | #292 | Tragic 97.2% |
| British West Indians | 0.0 /100 | #293 | Tragic 97.2% |
| Malaysians | 0.0 /100 | #294 | Tragic 97.1% |
| Immigrants | Grenada | 0.0 /100 | #295 | Tragic 97.1% |
| Immigrants | Immigrants | 0.0 /100 | #296 | Tragic 97.1% |
| Immigrants | Cuba | 0.0 /100 | #297 | Tragic 97.0% |
| Immigrants | Dominica | 0.0 /100 | #298 | Tragic 97.0% |
| Haitians | 0.0 /100 | #299 | Tragic 97.0% |
| Immigrants | South Eastern Asia | 0.0 /100 | #300 | Tragic 97.0% |
Demographics Similar to Shoshone by 2nd Grade
In terms of 2nd grade, the demographic groups most similar to Shoshone are Cherokee (98.3%, a difference of 0.0%), Immigrants from England (98.3%, a difference of 0.0%), Immigrants from Netherlands (98.3%, a difference of 0.010%), Immigrants from Lithuania (98.2%, a difference of 0.010%), and Immigrants from Belgium (98.2%, a difference of 0.010%).
| Demographics | Rating | Rank | 2nd Grade |
| Russians | 99.7 /100 | #68 | Exceptional 98.3% |
| Immigrants | Austria | 99.6 /100 | #69 | Exceptional 98.3% |
| Serbians | 99.6 /100 | #70 | Exceptional 98.3% |
| Chickasaw | 99.6 /100 | #71 | Exceptional 98.3% |
| Cheyenne | 99.6 /100 | #72 | Exceptional 98.3% |
| Cajuns | 99.5 /100 | #73 | Exceptional 98.3% |
| Immigrants | Netherlands | 99.4 /100 | #74 | Exceptional 98.3% |
| Shoshone | 99.4 /100 | #75 | Exceptional 98.3% |
| Cherokee | 99.4 /100 | #76 | Exceptional 98.3% |
| Immigrants | England | 99.4 /100 | #77 | Exceptional 98.3% |
| Immigrants | Lithuania | 99.3 /100 | #78 | Exceptional 98.2% |
| Immigrants | Belgium | 99.3 /100 | #79 | Exceptional 98.2% |
| Osage | 99.2 /100 | #80 | Exceptional 98.2% |
| Icelanders | 99.2 /100 | #81 | Exceptional 98.2% |
| Delaware | 99.1 /100 | #82 | Exceptional 98.2% |