British vs American 2nd Grade
COMPARE
British
American
2nd Grade
2nd Grade Comparison
British
Americans
98.5%
2ND GRADE
100.0/ 100
METRIC RATING
36th/ 347
METRIC RANK
98.3%
2ND GRADE
99.8/ 100
METRIC RATING
56th/ 347
METRIC RANK
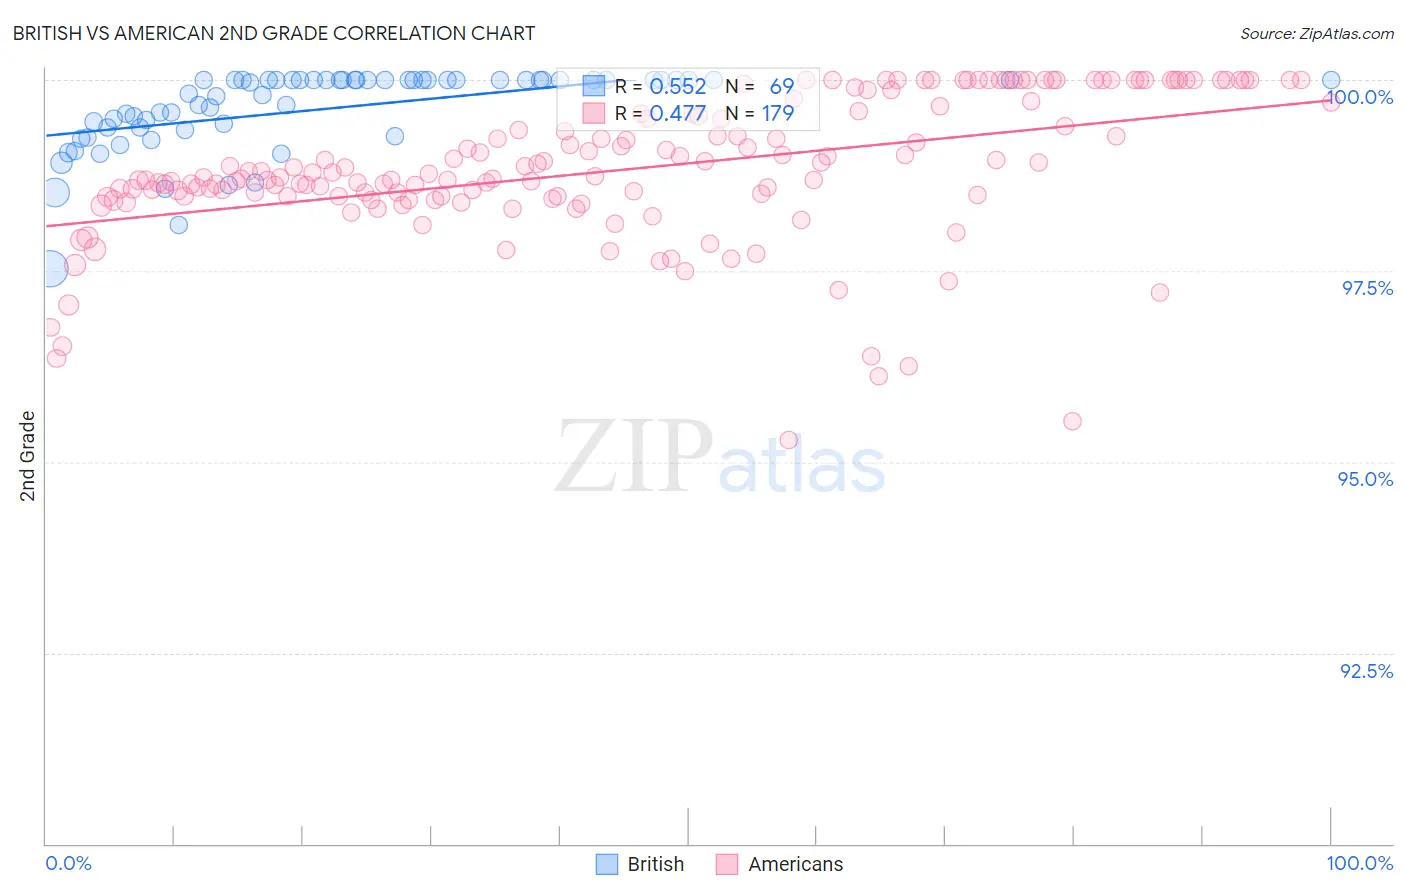
British vs American 2nd Grade Correlation Chart
The statistical analysis conducted on geographies consisting of 531,462,526 people shows a substantial positive correlation between the proportion of British and percentage of population with at least 2nd grade education in the United States with a correlation coefficient (R) of 0.552 and weighted average of 98.5%. Similarly, the statistical analysis conducted on geographies consisting of 581,990,776 people shows a moderate positive correlation between the proportion of Americans and percentage of population with at least 2nd grade education in the United States with a correlation coefficient (R) of 0.477 and weighted average of 98.3%, a difference of 0.13%.
2nd Grade Correlation Summary
| Measurement | British | American |
| Minimum | 97.5% | 95.3% |
| Maximum | 100.0% | 100.0% |
| Range | 2.5% | 4.7% |
| Mean | 99.6% | 98.8% |
| Median | 100.0% | 98.7% |
| Interquartile 25% (IQ1) | 99.4% | 98.5% |
| Interquartile 75% (IQ3) | 100.0% | 99.6% |
| Interquartile Range (IQR) | 0.64% | 1.1% |
| Standard Deviation (Sample) | 0.53% | 0.93% |
| Standard Deviation (Population) | 0.53% | 0.93% |
Demographics Similar to British and Americans by 2nd Grade
In terms of 2nd grade, the demographic groups most similar to British are Italian (98.4%, a difference of 0.020%), Latvian (98.4%, a difference of 0.030%), Chippewa (98.4%, a difference of 0.030%), Luxembourger (98.4%, a difference of 0.030%), and Eastern European (98.4%, a difference of 0.040%). Similarly, the demographic groups most similar to Americans are Pueblo (98.3%, a difference of 0.010%), Kiowa (98.3%, a difference of 0.010%), Immigrants from Scotland (98.3%, a difference of 0.010%), Celtic (98.4%, a difference of 0.020%), and White/Caucasian (98.4%, a difference of 0.020%).
| Demographics | Rating | Rank | 2nd Grade |
| British | 100.0 /100 | #36 | Exceptional 98.5% |
| Italians | 99.9 /100 | #37 | Exceptional 98.4% |
| Latvians | 99.9 /100 | #38 | Exceptional 98.4% |
| Chippewa | 99.9 /100 | #39 | Exceptional 98.4% |
| Luxembourgers | 99.9 /100 | #40 | Exceptional 98.4% |
| Eastern Europeans | 99.9 /100 | #41 | Exceptional 98.4% |
| Native Hawaiians | 99.9 /100 | #42 | Exceptional 98.4% |
| Belgians | 99.9 /100 | #43 | Exceptional 98.4% |
| Northern Europeans | 99.9 /100 | #44 | Exceptional 98.4% |
| Hungarians | 99.9 /100 | #45 | Exceptional 98.4% |
| Lumbee | 99.9 /100 | #46 | Exceptional 98.4% |
| Ottawa | 99.9 /100 | #47 | Exceptional 98.4% |
| Czechoslovakians | 99.9 /100 | #48 | Exceptional 98.4% |
| Celtics | 99.8 /100 | #49 | Exceptional 98.4% |
| Whites/Caucasians | 99.8 /100 | #50 | Exceptional 98.4% |
| Estonians | 99.8 /100 | #51 | Exceptional 98.4% |
| Australians | 99.8 /100 | #52 | Exceptional 98.4% |
| Pueblo | 99.8 /100 | #53 | Exceptional 98.3% |
| Kiowa | 99.8 /100 | #54 | Exceptional 98.3% |
| Immigrants | Scotland | 99.8 /100 | #55 | Exceptional 98.3% |
| Americans | 99.8 /100 | #56 | Exceptional 98.3% |