British vs Immigrants from Ethiopia 7th Grade
COMPARE
British
Immigrants from Ethiopia
7th Grade
7th Grade Comparison
British
Immigrants from Ethiopia
97.2%
7TH GRADE
100.0/ 100
METRIC RATING
37th/ 347
METRIC RANK
95.3%
7TH GRADE
0.9/ 100
METRIC RATING
252nd/ 347
METRIC RANK
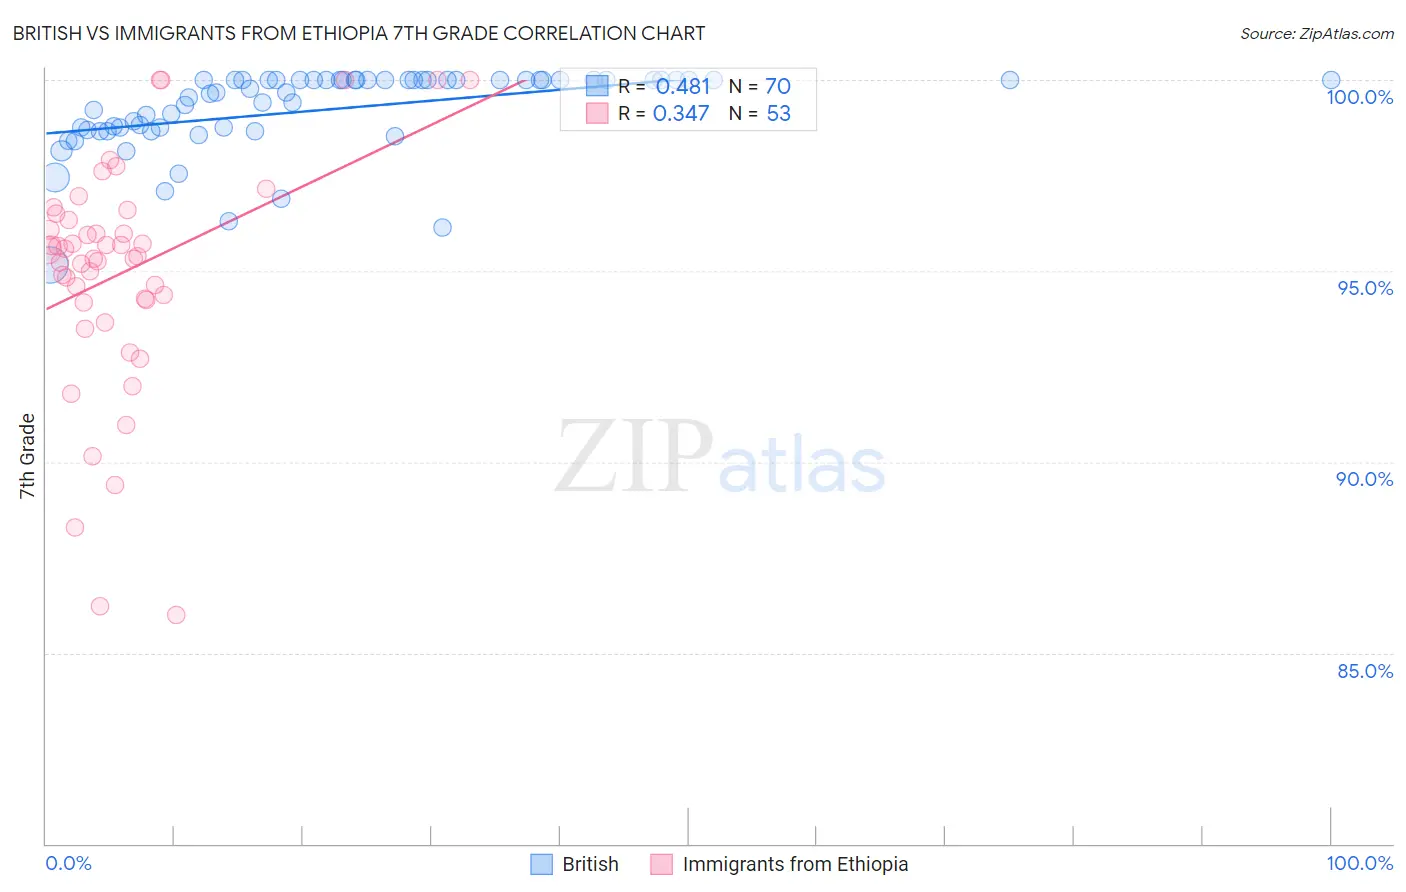
British vs Immigrants from Ethiopia 7th Grade Correlation Chart
The statistical analysis conducted on geographies consisting of 531,462,837 people shows a moderate positive correlation between the proportion of British and percentage of population with at least 7th grade education in the United States with a correlation coefficient (R) of 0.481 and weighted average of 97.2%. Similarly, the statistical analysis conducted on geographies consisting of 211,528,629 people shows a mild positive correlation between the proportion of Immigrants from Ethiopia and percentage of population with at least 7th grade education in the United States with a correlation coefficient (R) of 0.347 and weighted average of 95.3%, a difference of 2.0%.
7th Grade Correlation Summary
| Measurement | British | Immigrants from Ethiopia |
| Minimum | 95.2% | 86.0% |
| Maximum | 100.0% | 100.0% |
| Range | 4.8% | 14.0% |
| Mean | 99.2% | 95.0% |
| Median | 99.7% | 95.4% |
| Interquartile 25% (IQ1) | 98.7% | 94.2% |
| Interquartile 75% (IQ3) | 100.0% | 96.4% |
| Interquartile Range (IQR) | 1.3% | 2.2% |
| Standard Deviation (Sample) | 1.1% | 3.0% |
| Standard Deviation (Population) | 1.1% | 3.0% |
Similar Demographics by 7th Grade
Demographics Similar to British by 7th Grade
In terms of 7th grade, the demographic groups most similar to British are Hungarian (97.2%, a difference of 0.010%), Belgian (97.2%, a difference of 0.010%), Latvian (97.2%, a difference of 0.020%), Luxembourger (97.2%, a difference of 0.020%), and Eastern European (97.2%, a difference of 0.040%).
| Demographics | Rating | Rank | 7th Grade |
| Czechs | 100.0 /100 | #30 | Exceptional 97.4% |
| Europeans | 100.0 /100 | #31 | Exceptional 97.3% |
| Italians | 100.0 /100 | #32 | Exceptional 97.3% |
| Chippewa | 100.0 /100 | #33 | Exceptional 97.3% |
| Alaska Natives | 100.0 /100 | #34 | Exceptional 97.3% |
| Swiss | 100.0 /100 | #35 | Exceptional 97.3% |
| Hungarians | 100.0 /100 | #36 | Exceptional 97.2% |
| British | 100.0 /100 | #37 | Exceptional 97.2% |
| Belgians | 100.0 /100 | #38 | Exceptional 97.2% |
| Latvians | 100.0 /100 | #39 | Exceptional 97.2% |
| Luxembourgers | 100.0 /100 | #40 | Exceptional 97.2% |
| Eastern Europeans | 100.0 /100 | #41 | Exceptional 97.2% |
| Chinese | 99.9 /100 | #42 | Exceptional 97.1% |
| Maltese | 99.9 /100 | #43 | Exceptional 97.1% |
| Northern Europeans | 99.9 /100 | #44 | Exceptional 97.1% |
Demographics Similar to Immigrants from Ethiopia by 7th Grade
In terms of 7th grade, the demographic groups most similar to Immigrants from Ethiopia are Immigrants from Cameroon (95.4%, a difference of 0.0%), Immigrants from Jamaica (95.4%, a difference of 0.0%), Somali (95.3%, a difference of 0.010%), Colombian (95.3%, a difference of 0.020%), and Paiute (95.4%, a difference of 0.030%).
| Demographics | Rating | Rank | 7th Grade |
| Immigrants | Middle Africa | 1.5 /100 | #245 | Tragic 95.4% |
| Ethiopians | 1.5 /100 | #246 | Tragic 95.4% |
| Tongans | 1.3 /100 | #247 | Tragic 95.4% |
| Paiute | 1.2 /100 | #248 | Tragic 95.4% |
| Bolivians | 1.1 /100 | #249 | Tragic 95.4% |
| Immigrants | Cameroon | 0.9 /100 | #250 | Tragic 95.4% |
| Immigrants | Jamaica | 0.9 /100 | #251 | Tragic 95.4% |
| Immigrants | Ethiopia | 0.9 /100 | #252 | Tragic 95.3% |
| Somalis | 0.9 /100 | #253 | Tragic 95.3% |
| Colombians | 0.8 /100 | #254 | Tragic 95.3% |
| Koreans | 0.8 /100 | #255 | Tragic 95.3% |
| Immigrants | China | 0.7 /100 | #256 | Tragic 95.3% |
| Immigrants | Congo | 0.7 /100 | #257 | Tragic 95.3% |
| Ghanaians | 0.7 /100 | #258 | Tragic 95.3% |
| Immigrants | Costa Rica | 0.6 /100 | #259 | Tragic 95.3% |