British vs British West Indian Disability Age 65 to 74
COMPARE
British
British West Indian
Disability Age 65 to 74
Disability Age 65 to 74 Comparison
British
British West Indians
23.0%
DISABILITY AGE 65 TO 74
73.9/ 100
METRIC RATING
155th/ 347
METRIC RANK
24.7%
DISABILITY AGE 65 TO 74
2.0/ 100
METRIC RATING
245th/ 347
METRIC RANK
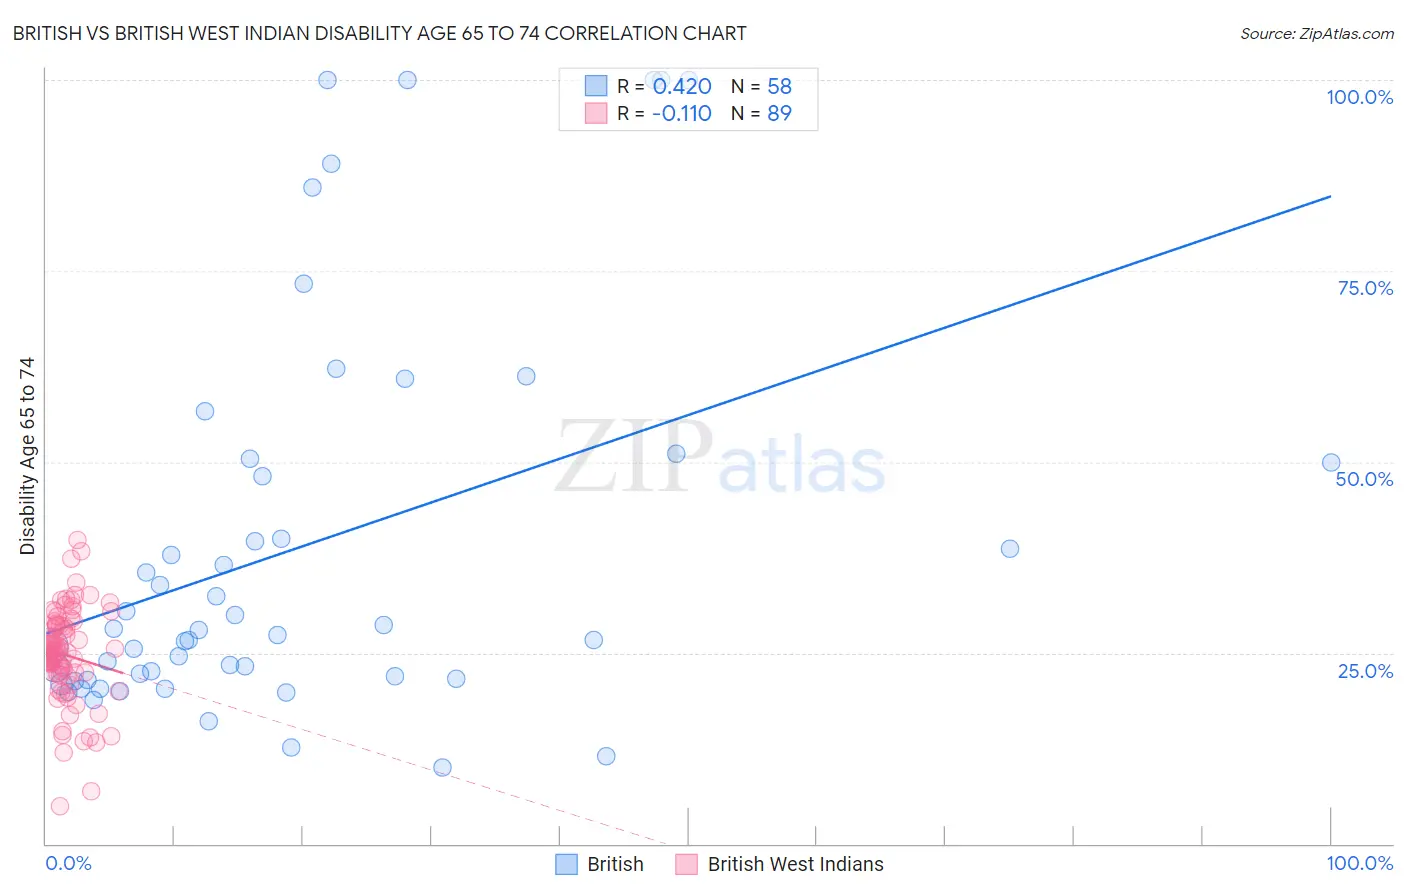
British vs British West Indian Disability Age 65 to 74 Correlation Chart
The statistical analysis conducted on geographies consisting of 529,866,970 people shows a moderate positive correlation between the proportion of British and percentage of population with a disability between the ages 65 and 75 in the United States with a correlation coefficient (R) of 0.420 and weighted average of 23.0%. Similarly, the statistical analysis conducted on geographies consisting of 152,475,853 people shows a poor negative correlation between the proportion of British West Indians and percentage of population with a disability between the ages 65 and 75 in the United States with a correlation coefficient (R) of -0.110 and weighted average of 24.7%, a difference of 7.3%.
Disability Age 65 to 74 Correlation Summary
| Measurement | British | British West Indian |
| Minimum | 10.0% | 4.9% |
| Maximum | 100.0% | 39.7% |
| Range | 90.0% | 34.8% |
| Mean | 38.7% | 24.7% |
| Median | 27.6% | 25.1% |
| Interquartile 25% (IQ1) | 21.6% | 22.3% |
| Interquartile 75% (IQ3) | 50.0% | 28.6% |
| Interquartile Range (IQR) | 28.4% | 6.3% |
| Standard Deviation (Sample) | 25.5% | 6.2% |
| Standard Deviation (Population) | 25.2% | 6.2% |
Similar Demographics by Disability Age 65 to 74
Demographics Similar to British by Disability Age 65 to 74
In terms of disability age 65 to 74, the demographic groups most similar to British are Sri Lankan (23.0%, a difference of 0.010%), Immigrants from Western Asia (23.0%, a difference of 0.010%), Slavic (23.0%, a difference of 0.10%), Czechoslovakian (23.0%, a difference of 0.11%), and Finnish (22.9%, a difference of 0.21%).
| Demographics | Rating | Rank | Disability Age 65 to 74 |
| New Zealanders | 79.9 /100 | #148 | Good 22.9% |
| Swiss | 79.7 /100 | #149 | Good 22.9% |
| Canadians | 77.7 /100 | #150 | Good 22.9% |
| Immigrants | Morocco | 77.6 /100 | #151 | Good 22.9% |
| Finns | 76.5 /100 | #152 | Good 22.9% |
| Slavs | 75.2 /100 | #153 | Good 23.0% |
| Sri Lankans | 74.0 /100 | #154 | Good 23.0% |
| British | 73.9 /100 | #155 | Good 23.0% |
| Immigrants | Western Asia | 73.8 /100 | #156 | Good 23.0% |
| Czechoslovakians | 72.4 /100 | #157 | Good 23.0% |
| Immigrants | Vietnam | 69.1 /100 | #158 | Good 23.1% |
| South American Indians | 65.5 /100 | #159 | Good 23.1% |
| Koreans | 64.2 /100 | #160 | Good 23.1% |
| Immigrants | Cameroon | 63.8 /100 | #161 | Good 23.1% |
| Europeans | 61.2 /100 | #162 | Good 23.2% |
Demographics Similar to British West Indians by Disability Age 65 to 74
In terms of disability age 65 to 74, the demographic groups most similar to British West Indians are Armenian (24.7%, a difference of 0.0%), Immigrants from Iraq (24.7%, a difference of 0.060%), Spanish (24.6%, a difference of 0.13%), Immigrants from Senegal (24.6%, a difference of 0.14%), and Immigrants from Western Africa (24.6%, a difference of 0.22%).
| Demographics | Rating | Rank | Disability Age 65 to 74 |
| Immigrants | Ghana | 3.0 /100 | #238 | Tragic 24.5% |
| Immigrants | Caribbean | 2.6 /100 | #239 | Tragic 24.6% |
| Spaniards | 2.4 /100 | #240 | Tragic 24.6% |
| Immigrants | Western Africa | 2.3 /100 | #241 | Tragic 24.6% |
| Immigrants | Senegal | 2.2 /100 | #242 | Tragic 24.6% |
| Spanish | 2.2 /100 | #243 | Tragic 24.6% |
| Armenians | 2.0 /100 | #244 | Tragic 24.7% |
| British West Indians | 2.0 /100 | #245 | Tragic 24.7% |
| Immigrants | Iraq | 1.9 /100 | #246 | Tragic 24.7% |
| Indonesians | 1.1 /100 | #247 | Tragic 24.9% |
| Senegalese | 0.9 /100 | #248 | Tragic 24.9% |
| Immigrants | Fiji | 0.8 /100 | #249 | Tragic 25.0% |
| Salvadorans | 0.8 /100 | #250 | Tragic 25.0% |
| Immigrants | Nonimmigrants | 0.7 /100 | #251 | Tragic 25.0% |
| Immigrants | El Salvador | 0.6 /100 | #252 | Tragic 25.1% |