Cajun vs American 2nd Grade
COMPARE
Cajun
American
2nd Grade
2nd Grade Comparison
Cajuns
Americans
98.3%
2ND GRADE
99.5/ 100
METRIC RATING
73rd/ 347
METRIC RANK
98.3%
2ND GRADE
99.8/ 100
METRIC RATING
56th/ 347
METRIC RANK
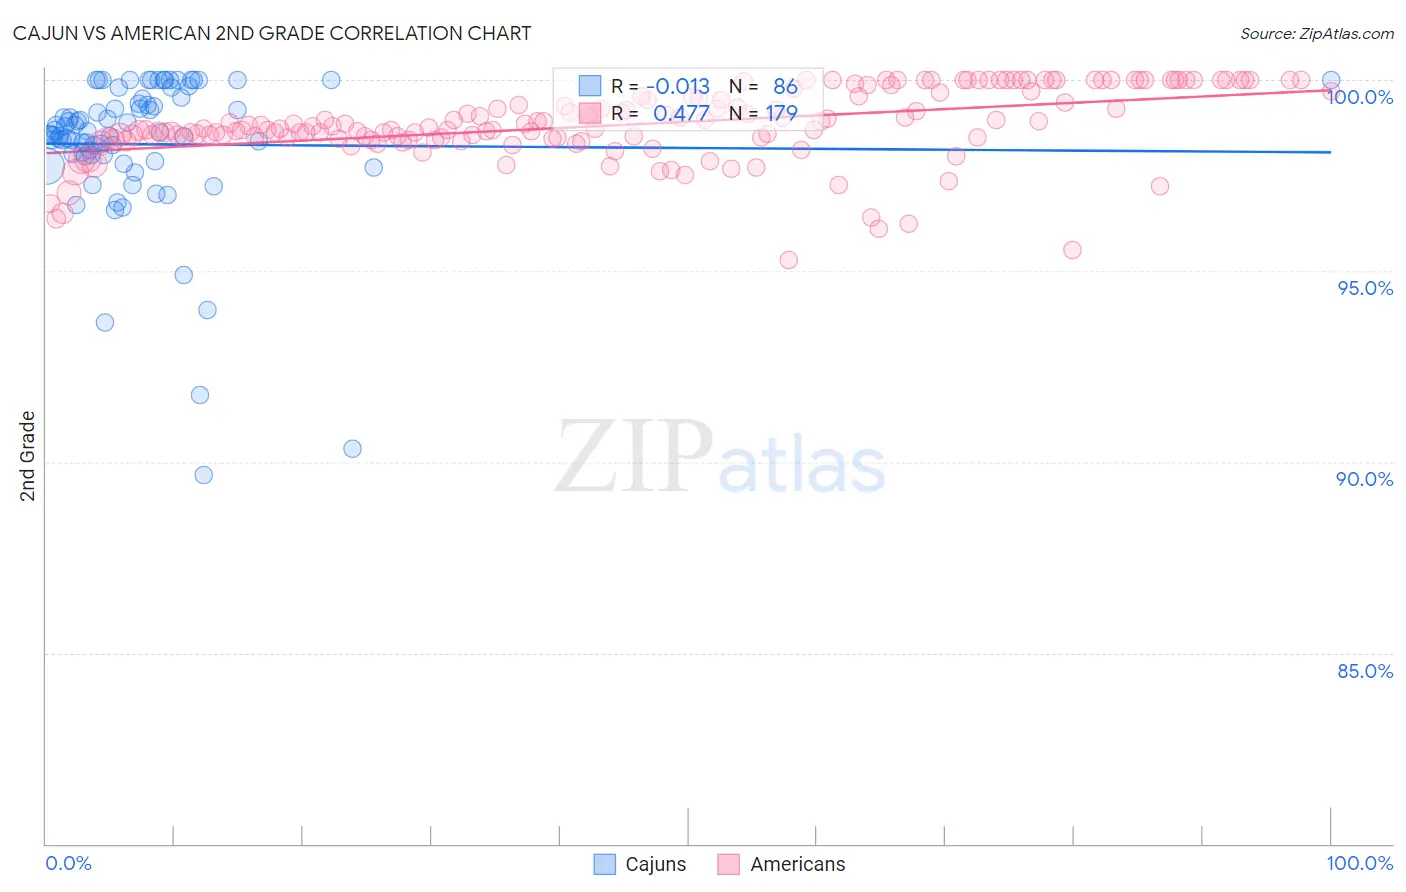
Cajun vs American 2nd Grade Correlation Chart
The statistical analysis conducted on geographies consisting of 149,712,957 people shows no correlation between the proportion of Cajuns and percentage of population with at least 2nd grade education in the United States with a correlation coefficient (R) of -0.013 and weighted average of 98.3%. Similarly, the statistical analysis conducted on geographies consisting of 581,990,776 people shows a moderate positive correlation between the proportion of Americans and percentage of population with at least 2nd grade education in the United States with a correlation coefficient (R) of 0.477 and weighted average of 98.3%, a difference of 0.060%.
2nd Grade Correlation Summary
| Measurement | Cajun | American |
| Minimum | 89.7% | 95.3% |
| Maximum | 100.0% | 100.0% |
| Range | 10.3% | 4.7% |
| Mean | 98.3% | 98.8% |
| Median | 98.6% | 98.7% |
| Interquartile 25% (IQ1) | 98.0% | 98.5% |
| Interquartile 75% (IQ3) | 99.5% | 99.6% |
| Interquartile Range (IQR) | 1.5% | 1.1% |
| Standard Deviation (Sample) | 1.9% | 0.93% |
| Standard Deviation (Population) | 1.9% | 0.93% |
Demographics Similar to Cajuns and Americans by 2nd Grade
In terms of 2nd grade, the demographic groups most similar to Cajuns are Cheyenne (98.3%, a difference of 0.0%), Chickasaw (98.3%, a difference of 0.010%), Canadian (98.3%, a difference of 0.020%), Immigrants from Northern Europe (98.3%, a difference of 0.020%), and Russian (98.3%, a difference of 0.020%). Similarly, the demographic groups most similar to Americans are Austrian (98.3%, a difference of 0.0%), Bulgarian (98.3%, a difference of 0.0%), Kiowa (98.3%, a difference of 0.010%), Immigrants from Scotland (98.3%, a difference of 0.010%), and Slavic (98.3%, a difference of 0.010%).
| Demographics | Rating | Rank | 2nd Grade |
| Kiowa | 99.8 /100 | #54 | Exceptional 98.3% |
| Immigrants | Scotland | 99.8 /100 | #55 | Exceptional 98.3% |
| Americans | 99.8 /100 | #56 | Exceptional 98.3% |
| Austrians | 99.8 /100 | #57 | Exceptional 98.3% |
| Bulgarians | 99.8 /100 | #58 | Exceptional 98.3% |
| Slavs | 99.8 /100 | #59 | Exceptional 98.3% |
| Creek | 99.8 /100 | #60 | Exceptional 98.3% |
| Immigrants | Canada | 99.8 /100 | #61 | Exceptional 98.3% |
| Greeks | 99.8 /100 | #62 | Exceptional 98.3% |
| Maltese | 99.7 /100 | #63 | Exceptional 98.3% |
| Immigrants | North America | 99.7 /100 | #64 | Exceptional 98.3% |
| New Zealanders | 99.7 /100 | #65 | Exceptional 98.3% |
| Canadians | 99.7 /100 | #66 | Exceptional 98.3% |
| Immigrants | Northern Europe | 99.7 /100 | #67 | Exceptional 98.3% |
| Russians | 99.7 /100 | #68 | Exceptional 98.3% |
| Immigrants | Austria | 99.6 /100 | #69 | Exceptional 98.3% |
| Serbians | 99.6 /100 | #70 | Exceptional 98.3% |
| Chickasaw | 99.6 /100 | #71 | Exceptional 98.3% |
| Cheyenne | 99.6 /100 | #72 | Exceptional 98.3% |
| Cajuns | 99.5 /100 | #73 | Exceptional 98.3% |
| Immigrants | Netherlands | 99.4 /100 | #74 | Exceptional 98.3% |