Alaskan Athabascan vs American 2nd Grade
COMPARE
Alaskan Athabascan
American
2nd Grade
2nd Grade Comparison
Alaskan Athabascans
Americans
98.7%
2ND GRADE
100.0/ 100
METRIC RATING
5th/ 347
METRIC RANK
98.3%
2ND GRADE
99.8/ 100
METRIC RATING
56th/ 347
METRIC RANK
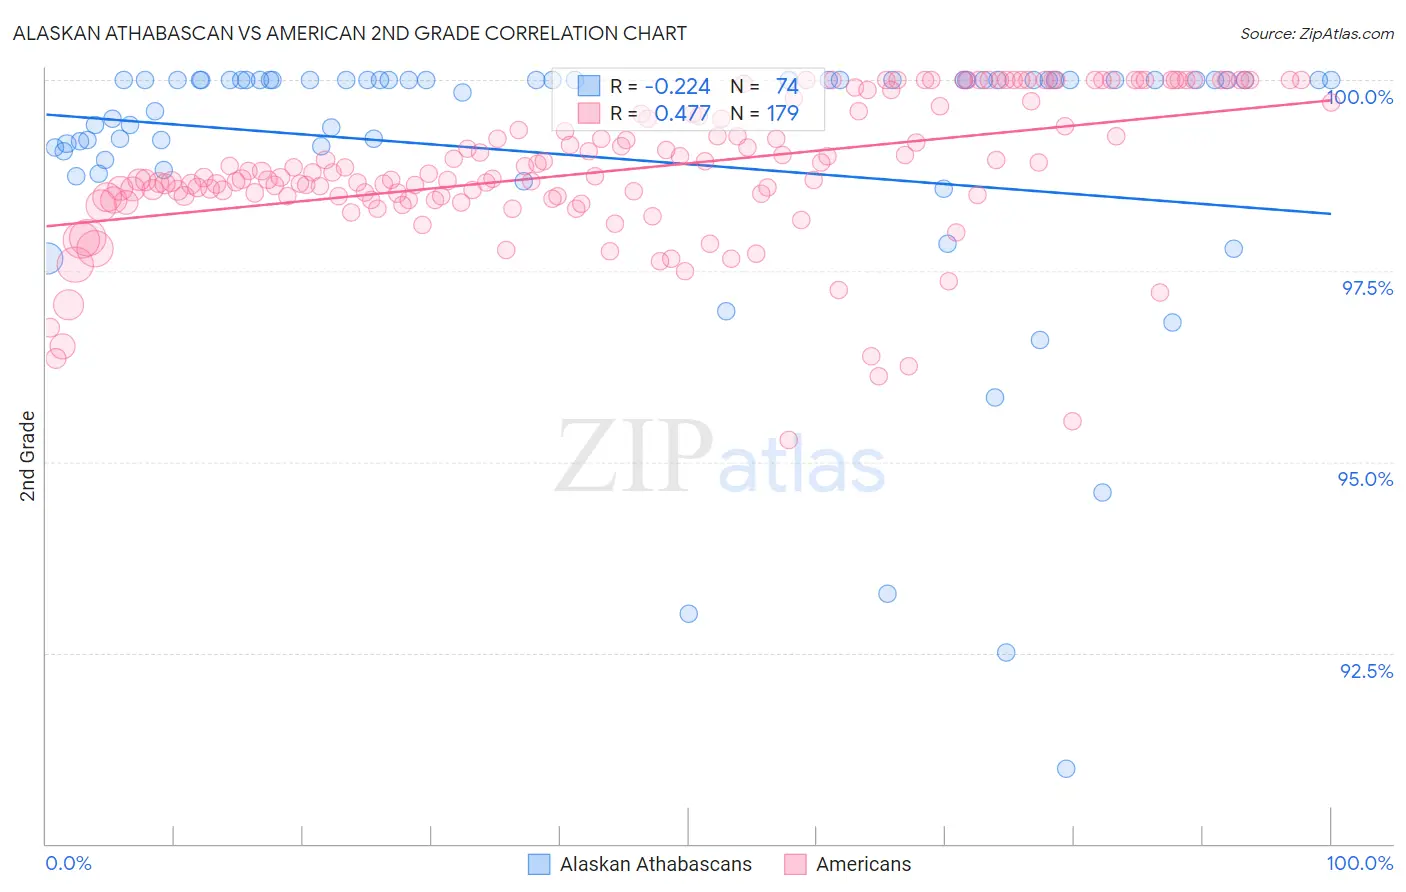
Alaskan Athabascan vs American 2nd Grade Correlation Chart
The statistical analysis conducted on geographies consisting of 45,820,365 people shows a weak negative correlation between the proportion of Alaskan Athabascans and percentage of population with at least 2nd grade education in the United States with a correlation coefficient (R) of -0.224 and weighted average of 98.7%. Similarly, the statistical analysis conducted on geographies consisting of 581,990,776 people shows a moderate positive correlation between the proportion of Americans and percentage of population with at least 2nd grade education in the United States with a correlation coefficient (R) of 0.477 and weighted average of 98.3%, a difference of 0.39%.
2nd Grade Correlation Summary
| Measurement | Alaskan Athabascan | American |
| Minimum | 91.0% | 95.3% |
| Maximum | 100.0% | 100.0% |
| Range | 9.0% | 4.7% |
| Mean | 99.0% | 98.8% |
| Median | 100.0% | 98.7% |
| Interquartile 25% (IQ1) | 99.1% | 98.5% |
| Interquartile 75% (IQ3) | 100.0% | 99.6% |
| Interquartile Range (IQR) | 0.94% | 1.1% |
| Standard Deviation (Sample) | 1.9% | 0.93% |
| Standard Deviation (Population) | 1.9% | 0.93% |
Similar Demographics by 2nd Grade
Demographics Similar to Alaskan Athabascans by 2nd Grade
In terms of 2nd grade, the demographic groups most similar to Alaskan Athabascans are Alaska Native (98.7%, a difference of 0.040%), Norwegian (98.7%, a difference of 0.050%), German (98.7%, a difference of 0.070%), Slovak (98.7%, a difference of 0.070%), and Tsimshian (98.8%, a difference of 0.080%).
| Demographics | Rating | Rank | 2nd Grade |
| Crow | 100.0 /100 | #1 | Exceptional 99.6% |
| Yup'ik | 100.0 /100 | #2 | Exceptional 99.2% |
| Inupiat | 100.0 /100 | #3 | Exceptional 98.8% |
| Tsimshian | 100.0 /100 | #4 | Exceptional 98.8% |
| Alaskan Athabascans | 100.0 /100 | #5 | Exceptional 98.7% |
| Alaska Natives | 100.0 /100 | #6 | Exceptional 98.7% |
| Norwegians | 100.0 /100 | #7 | Exceptional 98.7% |
| Germans | 100.0 /100 | #8 | Exceptional 98.7% |
| Slovaks | 100.0 /100 | #9 | Exceptional 98.7% |
| Slovenes | 100.0 /100 | #10 | Exceptional 98.6% |
| Tlingit-Haida | 100.0 /100 | #11 | Exceptional 98.6% |
| Carpatho Rusyns | 100.0 /100 | #12 | Exceptional 98.6% |
| English | 100.0 /100 | #13 | Exceptional 98.6% |
| Swedes | 100.0 /100 | #14 | Exceptional 98.6% |
| Scottish | 100.0 /100 | #15 | Exceptional 98.6% |
Demographics Similar to Americans by 2nd Grade
In terms of 2nd grade, the demographic groups most similar to Americans are Austrian (98.3%, a difference of 0.0%), Bulgarian (98.3%, a difference of 0.0%), Pueblo (98.3%, a difference of 0.010%), Kiowa (98.3%, a difference of 0.010%), and Immigrants from Scotland (98.3%, a difference of 0.010%).
| Demographics | Rating | Rank | 2nd Grade |
| Celtics | 99.8 /100 | #49 | Exceptional 98.4% |
| Whites/Caucasians | 99.8 /100 | #50 | Exceptional 98.4% |
| Estonians | 99.8 /100 | #51 | Exceptional 98.4% |
| Australians | 99.8 /100 | #52 | Exceptional 98.4% |
| Pueblo | 99.8 /100 | #53 | Exceptional 98.3% |
| Kiowa | 99.8 /100 | #54 | Exceptional 98.3% |
| Immigrants | Scotland | 99.8 /100 | #55 | Exceptional 98.3% |
| Americans | 99.8 /100 | #56 | Exceptional 98.3% |
| Austrians | 99.8 /100 | #57 | Exceptional 98.3% |
| Bulgarians | 99.8 /100 | #58 | Exceptional 98.3% |
| Slavs | 99.8 /100 | #59 | Exceptional 98.3% |
| Creek | 99.8 /100 | #60 | Exceptional 98.3% |
| Immigrants | Canada | 99.8 /100 | #61 | Exceptional 98.3% |
| Greeks | 99.8 /100 | #62 | Exceptional 98.3% |
| Maltese | 99.7 /100 | #63 | Exceptional 98.3% |