Brazilian vs Mexican 12th Grade, No Diploma
COMPARE
Brazilian
Mexican
12th Grade, No Diploma
12th Grade, No Diploma Comparison
Brazilians
Mexicans
91.3%
12TH GRADE, NO DIPLOMA
62.0/ 100
METRIC RATING
162nd/ 347
METRIC RANK
84.1%
12TH GRADE, NO DIPLOMA
0.0/ 100
METRIC RATING
340th/ 347
METRIC RANK
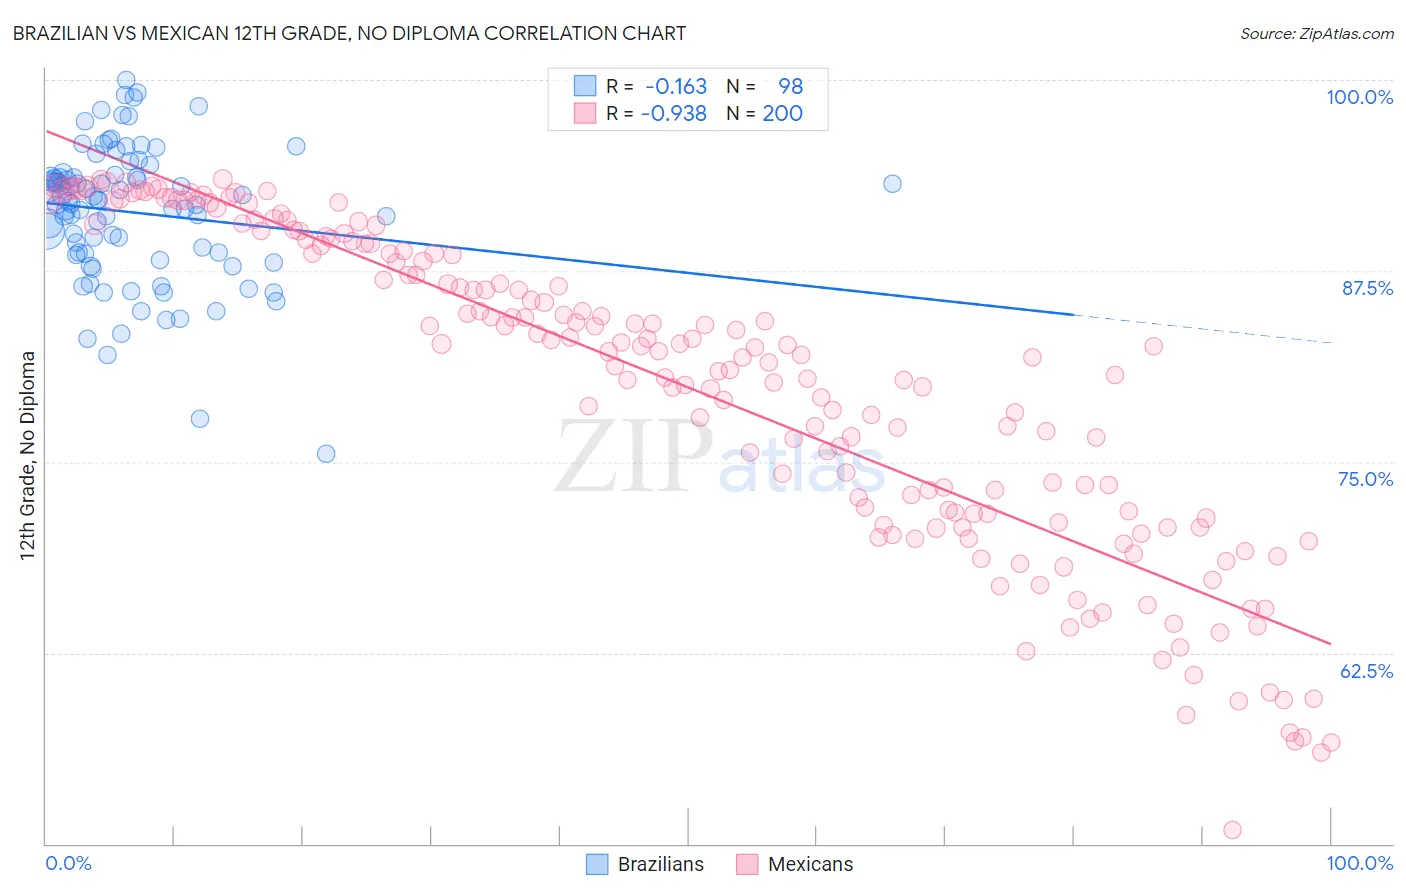
Brazilian vs Mexican 12th Grade, No Diploma Correlation Chart
The statistical analysis conducted on geographies consisting of 323,949,472 people shows a poor negative correlation between the proportion of Brazilians and percentage of population with at least 12th grade (no diploma) education in the United States with a correlation coefficient (R) of -0.163 and weighted average of 91.3%. Similarly, the statistical analysis conducted on geographies consisting of 565,338,354 people shows a near-perfect negative correlation between the proportion of Mexicans and percentage of population with at least 12th grade (no diploma) education in the United States with a correlation coefficient (R) of -0.938 and weighted average of 84.1%, a difference of 8.5%.
12th Grade, No Diploma Correlation Summary
| Measurement | Brazilian | Mexican |
| Minimum | 75.6% | 50.9% |
| Maximum | 100.0% | 93.5% |
| Range | 24.4% | 42.6% |
| Mean | 91.3% | 79.9% |
| Median | 92.1% | 82.2% |
| Interquartile 25% (IQ1) | 88.6% | 71.6% |
| Interquartile 75% (IQ3) | 93.6% | 89.2% |
| Interquartile Range (IQR) | 5.0% | 17.6% |
| Standard Deviation (Sample) | 4.5% | 10.4% |
| Standard Deviation (Population) | 4.5% | 10.3% |
Similar Demographics by 12th Grade, No Diploma
Demographics Similar to Brazilians by 12th Grade, No Diploma
In terms of 12th grade, no diploma, the demographic groups most similar to Brazilians are Immigrants from Asia (91.3%, a difference of 0.010%), Immigrants from China (91.3%, a difference of 0.010%), Immigrants from Hong Kong (91.3%, a difference of 0.020%), Laotian (91.3%, a difference of 0.030%), and Immigrants from Albania (91.3%, a difference of 0.030%).
| Demographics | Rating | Rank | 12th Grade, No Diploma |
| Immigrants | Iraq | 73.0 /100 | #155 | Good 91.4% |
| Asians | 71.9 /100 | #156 | Good 91.4% |
| Immigrants | Pakistan | 70.7 /100 | #157 | Good 91.4% |
| Immigrants | Northern Africa | 66.2 /100 | #158 | Good 91.4% |
| Laotians | 64.4 /100 | #159 | Good 91.3% |
| Immigrants | Albania | 64.1 /100 | #160 | Good 91.3% |
| Immigrants | Hong Kong | 63.8 /100 | #161 | Good 91.3% |
| Brazilians | 62.0 /100 | #162 | Good 91.3% |
| Immigrants | Asia | 61.5 /100 | #163 | Good 91.3% |
| Immigrants | China | 60.9 /100 | #164 | Good 91.3% |
| Alsatians | 58.3 /100 | #165 | Average 91.3% |
| Hmong | 58.0 /100 | #166 | Average 91.3% |
| Immigrants | Malaysia | 57.8 /100 | #167 | Average 91.3% |
| Cree | 57.0 /100 | #168 | Average 91.2% |
| Immigrants | Indonesia | 54.9 /100 | #169 | Average 91.2% |
Demographics Similar to Mexicans by 12th Grade, No Diploma
In terms of 12th grade, no diploma, the demographic groups most similar to Mexicans are Immigrants from Guatemala (84.0%, a difference of 0.14%), Salvadoran (84.5%, a difference of 0.41%), Houma (83.7%, a difference of 0.48%), Guatemalan (84.6%, a difference of 0.51%), and Pima (84.6%, a difference of 0.56%).
| Demographics | Rating | Rank | 12th Grade, No Diploma |
| Immigrants | Latin America | 0.0 /100 | #333 | Tragic 85.0% |
| Immigrants | Dominican Republic | 0.0 /100 | #334 | Tragic 84.9% |
| Immigrants | Yemen | 0.0 /100 | #335 | Tragic 84.8% |
| Tohono O'odham | 0.0 /100 | #336 | Tragic 84.7% |
| Pima | 0.0 /100 | #337 | Tragic 84.6% |
| Guatemalans | 0.0 /100 | #338 | Tragic 84.6% |
| Salvadorans | 0.0 /100 | #339 | Tragic 84.5% |
| Mexicans | 0.0 /100 | #340 | Tragic 84.1% |
| Immigrants | Guatemala | 0.0 /100 | #341 | Tragic 84.0% |
| Houma | 0.0 /100 | #342 | Tragic 83.7% |
| Immigrants | El Salvador | 0.0 /100 | #343 | Tragic 83.6% |
| Immigrants | Central America | 0.0 /100 | #344 | Tragic 83.0% |
| Spanish American Indians | 0.0 /100 | #345 | Tragic 82.9% |
| Yakama | 0.0 /100 | #346 | Tragic 82.5% |
| Immigrants | Mexico | 0.0 /100 | #347 | Tragic 82.4% |