Hungarian vs Immigrants from Argentina 12th Grade, No Diploma
COMPARE
Hungarian
Immigrants from Argentina
12th Grade, No Diploma
12th Grade, No Diploma Comparison
Hungarians
Immigrants from Argentina
92.8%
12TH GRADE, NO DIPLOMA
99.7/ 100
METRIC RATING
54th/ 347
METRIC RANK
91.6%
12TH GRADE, NO DIPLOMA
80.7/ 100
METRIC RATING
143rd/ 347
METRIC RANK
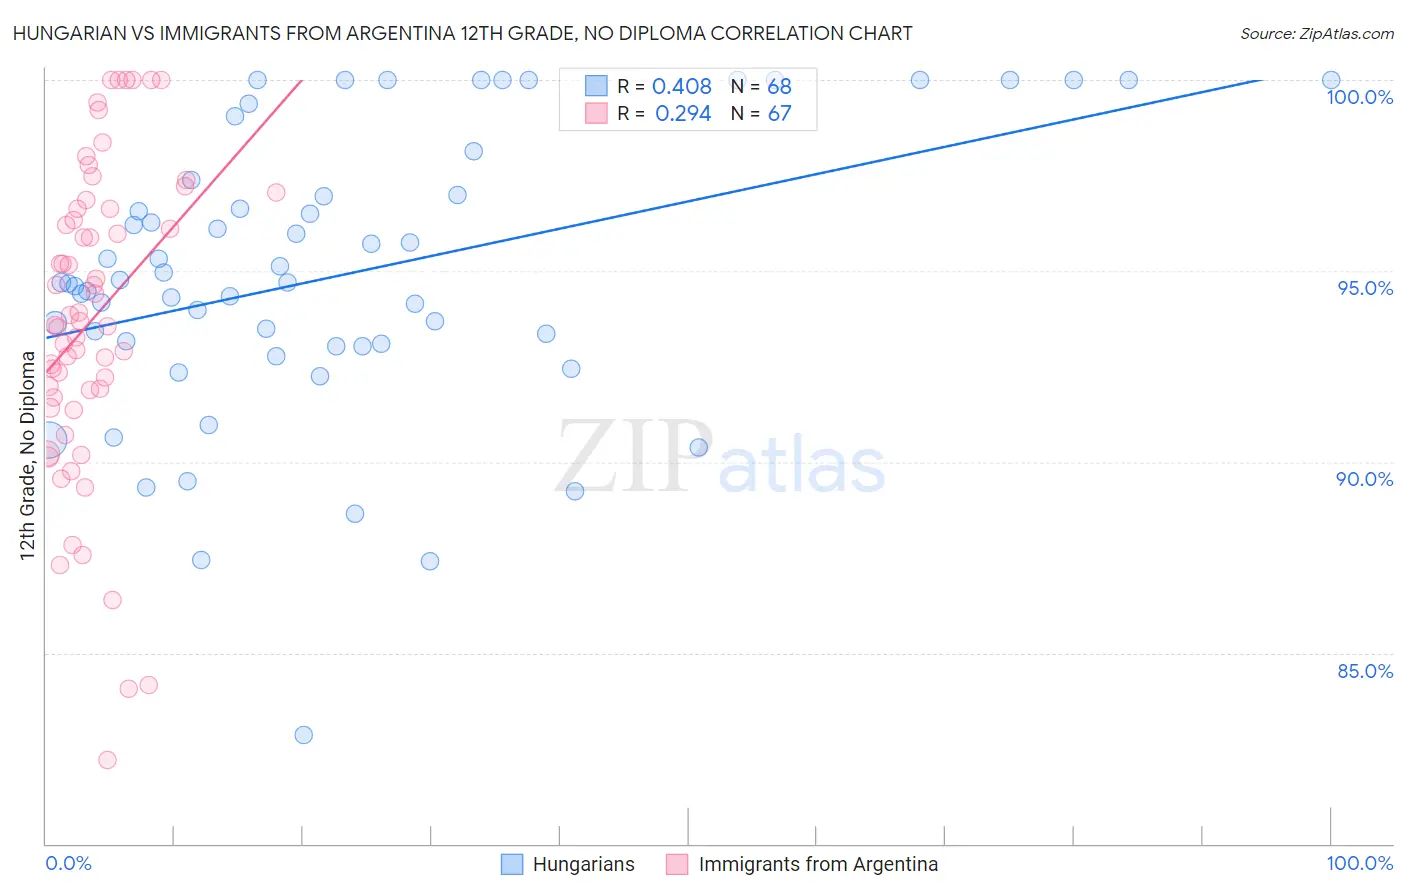
Hungarian vs Immigrants from Argentina 12th Grade, No Diploma Correlation Chart
The statistical analysis conducted on geographies consisting of 486,240,766 people shows a moderate positive correlation between the proportion of Hungarians and percentage of population with at least 12th grade (no diploma) education in the United States with a correlation coefficient (R) of 0.408 and weighted average of 92.8%. Similarly, the statistical analysis conducted on geographies consisting of 264,434,241 people shows a weak positive correlation between the proportion of Immigrants from Argentina and percentage of population with at least 12th grade (no diploma) education in the United States with a correlation coefficient (R) of 0.294 and weighted average of 91.6%, a difference of 1.4%.
12th Grade, No Diploma Correlation Summary
| Measurement | Hungarian | Immigrants from Argentina |
| Minimum | 82.9% | 82.2% |
| Maximum | 100.0% | 100.0% |
| Range | 17.1% | 17.8% |
| Mean | 94.9% | 93.8% |
| Median | 94.7% | 93.7% |
| Interquartile 25% (IQ1) | 93.1% | 91.7% |
| Interquartile 75% (IQ3) | 97.2% | 96.6% |
| Interquartile Range (IQR) | 4.1% | 4.9% |
| Standard Deviation (Sample) | 3.7% | 4.1% |
| Standard Deviation (Population) | 3.7% | 4.0% |
Similar Demographics by 12th Grade, No Diploma
Demographics Similar to Hungarians by 12th Grade, No Diploma
In terms of 12th grade, no diploma, the demographic groups most similar to Hungarians are Serbian (92.8%, a difference of 0.0%), Welsh (92.8%, a difference of 0.0%), Immigrants from Sweden (92.8%, a difference of 0.010%), New Zealander (92.8%, a difference of 0.010%), and Tsimshian (92.9%, a difference of 0.030%).
| Demographics | Rating | Rank | 12th Grade, No Diploma |
| Belgians | 99.8 /100 | #47 | Exceptional 92.9% |
| Australians | 99.8 /100 | #48 | Exceptional 92.9% |
| Macedonians | 99.8 /100 | #49 | Exceptional 92.9% |
| Tsimshian | 99.8 /100 | #50 | Exceptional 92.9% |
| Immigrants | Belgium | 99.8 /100 | #51 | Exceptional 92.9% |
| Immigrants | Sweden | 99.8 /100 | #52 | Exceptional 92.8% |
| Serbians | 99.7 /100 | #53 | Exceptional 92.8% |
| Hungarians | 99.7 /100 | #54 | Exceptional 92.8% |
| Welsh | 99.7 /100 | #55 | Exceptional 92.8% |
| New Zealanders | 99.7 /100 | #56 | Exceptional 92.8% |
| Immigrants | Canada | 99.7 /100 | #57 | Exceptional 92.8% |
| Immigrants | Taiwan | 99.7 /100 | #58 | Exceptional 92.8% |
| Immigrants | North America | 99.7 /100 | #59 | Exceptional 92.8% |
| Slavs | 99.7 /100 | #60 | Exceptional 92.8% |
| Immigrants | Japan | 99.7 /100 | #61 | Exceptional 92.8% |
Demographics Similar to Immigrants from Argentina by 12th Grade, No Diploma
In terms of 12th grade, no diploma, the demographic groups most similar to Immigrants from Argentina are Immigrants from Venezuela (91.6%, a difference of 0.0%), Immigrants from Spain (91.6%, a difference of 0.010%), Immigrants from Lebanon (91.6%, a difference of 0.010%), Immigrants from Brazil (91.5%, a difference of 0.020%), and Pakistani (91.5%, a difference of 0.020%).
| Demographics | Rating | Rank | 12th Grade, No Diploma |
| Chileans | 85.8 /100 | #136 | Excellent 91.7% |
| Alaska Natives | 84.9 /100 | #137 | Excellent 91.6% |
| Arabs | 84.1 /100 | #138 | Excellent 91.6% |
| Immigrants | Egypt | 83.9 /100 | #139 | Excellent 91.6% |
| Immigrants | Poland | 82.3 /100 | #140 | Excellent 91.6% |
| Argentineans | 82.0 /100 | #141 | Excellent 91.6% |
| Immigrants | Venezuela | 80.9 /100 | #142 | Excellent 91.6% |
| Immigrants | Argentina | 80.7 /100 | #143 | Excellent 91.6% |
| Immigrants | Spain | 80.1 /100 | #144 | Excellent 91.6% |
| Immigrants | Lebanon | 80.0 /100 | #145 | Excellent 91.6% |
| Immigrants | Brazil | 79.8 /100 | #146 | Good 91.5% |
| Pakistanis | 79.6 /100 | #147 | Good 91.5% |
| Indians (Asian) | 79.4 /100 | #148 | Good 91.5% |
| Ugandans | 79.0 /100 | #149 | Good 91.5% |
| Paraguayans | 78.9 /100 | #150 | Good 91.5% |