Kiowa vs Yuman Doctorate Degree
COMPARE
Kiowa
Yuman
Doctorate Degree
Doctorate Degree Comparison
Kiowa
Yuman
1.5%
DOCTORATE DEGREE
0.5/ 100
METRIC RATING
267th/ 347
METRIC RANK
1.5%
DOCTORATE DEGREE
1.1/ 100
METRIC RATING
252nd/ 347
METRIC RANK
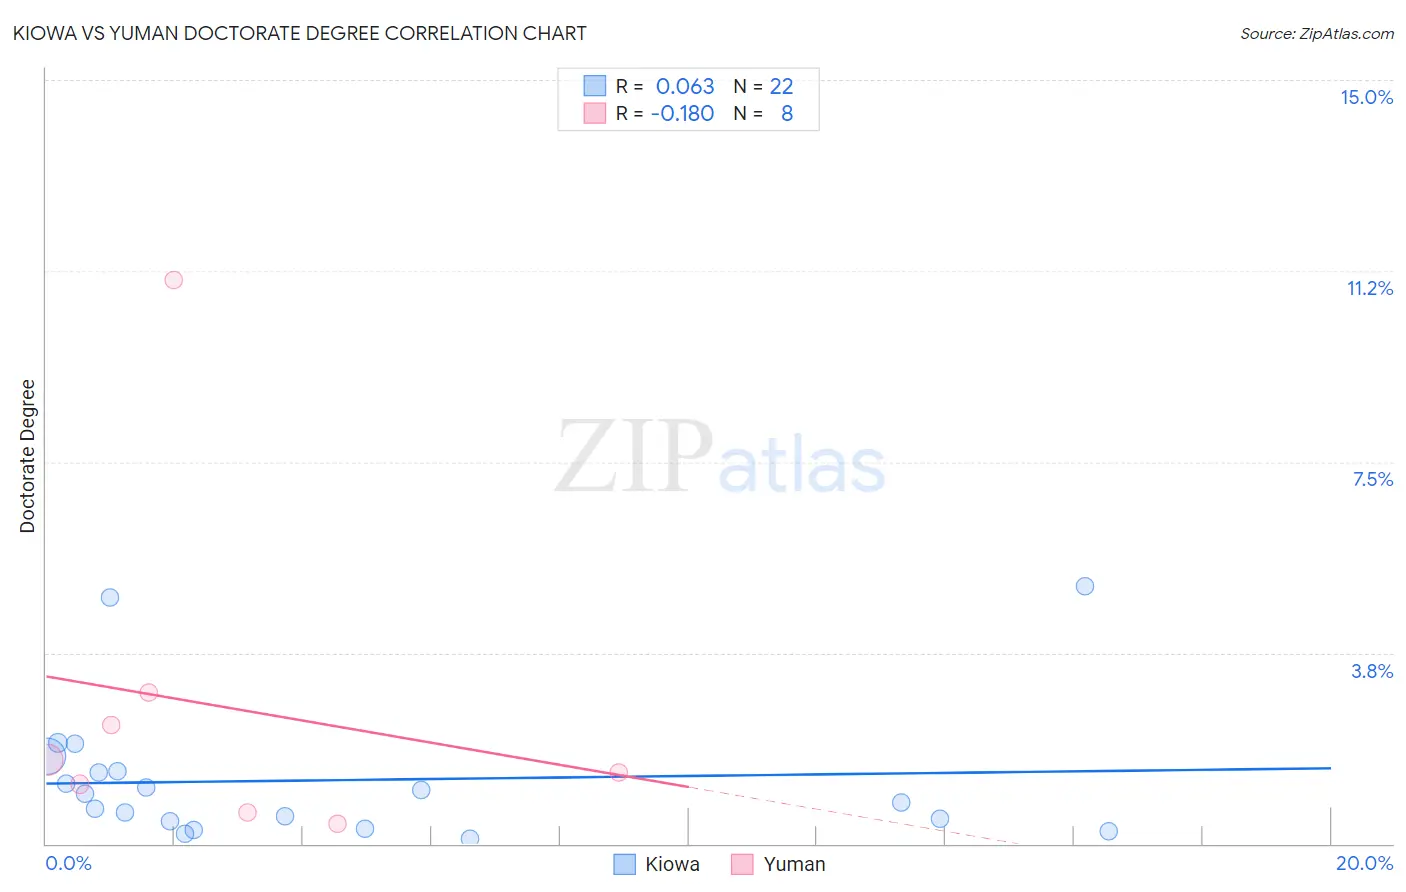
Kiowa vs Yuman Doctorate Degree Correlation Chart
The statistical analysis conducted on geographies consisting of 55,816,646 people shows a slight positive correlation between the proportion of Kiowa and percentage of population with at least doctorate degree education in the United States with a correlation coefficient (R) of 0.063 and weighted average of 1.5%. Similarly, the statistical analysis conducted on geographies consisting of 40,365,852 people shows a poor negative correlation between the proportion of Yuman and percentage of population with at least doctorate degree education in the United States with a correlation coefficient (R) of -0.180 and weighted average of 1.5%, a difference of 3.7%.
Doctorate Degree Correlation Summary
| Measurement | Kiowa | Yuman |
| Minimum | 0.10% | 0.38% |
| Maximum | 5.1% | 11.1% |
| Range | 4.9% | 10.7% |
| Mean | 1.2% | 2.7% |
| Median | 0.90% | 1.5% |
| Interquartile 25% (IQ1) | 0.44% | 0.89% |
| Interquartile 75% (IQ3) | 1.4% | 2.7% |
| Interquartile Range (IQR) | 0.98% | 1.8% |
| Standard Deviation (Sample) | 1.3% | 3.5% |
| Standard Deviation (Population) | 1.3% | 3.3% |
Demographics Similar to Kiowa and Yuman by Doctorate Degree
In terms of doctorate degree, the demographic groups most similar to Kiowa are U.S. Virgin Islander (1.5%, a difference of 0.0%), Crow (1.5%, a difference of 0.090%), Immigrants from Liberia (1.5%, a difference of 0.65%), Nicaraguan (1.5%, a difference of 1.4%), and Blackfeet (1.5%, a difference of 1.7%). Similarly, the demographic groups most similar to Yuman are American (1.5%, a difference of 0.15%), Immigrants from Cambodia (1.5%, a difference of 0.28%), Trinidadian and Tobagonian (1.5%, a difference of 0.28%), Central American Indian (1.5%, a difference of 0.33%), and Chippewa (1.5%, a difference of 0.55%).
| Demographics | Rating | Rank | Doctorate Degree |
| Potawatomi | 1.6 /100 | #249 | Tragic 1.6% |
| Immigrants | Fiji | 1.6 /100 | #250 | Tragic 1.6% |
| Apache | 1.3 /100 | #251 | Tragic 1.5% |
| Yuman | 1.1 /100 | #252 | Tragic 1.5% |
| Americans | 1.0 /100 | #253 | Tragic 1.5% |
| Immigrants | Cambodia | 1.0 /100 | #254 | Tragic 1.5% |
| Trinidadians and Tobagonians | 1.0 /100 | #255 | Tragic 1.5% |
| Central American Indians | 1.0 /100 | #256 | Tragic 1.5% |
| Chippewa | 0.9 /100 | #257 | Tragic 1.5% |
| Immigrants | West Indies | 0.9 /100 | #258 | Tragic 1.5% |
| Liberians | 0.9 /100 | #259 | Tragic 1.5% |
| Japanese | 0.9 /100 | #260 | Tragic 1.5% |
| Immigrants | Portugal | 0.8 /100 | #261 | Tragic 1.5% |
| Chickasaw | 0.7 /100 | #262 | Tragic 1.5% |
| Immigrants | Bahamas | 0.7 /100 | #263 | Tragic 1.5% |
| Blackfeet | 0.7 /100 | #264 | Tragic 1.5% |
| Nicaraguans | 0.6 /100 | #265 | Tragic 1.5% |
| Immigrants | Liberia | 0.5 /100 | #266 | Tragic 1.5% |
| Kiowa | 0.5 /100 | #267 | Tragic 1.5% |
| U.S. Virgin Islanders | 0.5 /100 | #268 | Tragic 1.5% |
| Crow | 0.5 /100 | #269 | Tragic 1.5% |