Bolivian vs Cypriot Doctorate Degree
COMPARE
Bolivian
Cypriot
Doctorate Degree
Doctorate Degree Comparison
Bolivians
Cypriots
2.4%
DOCTORATE DEGREE
100.0/ 100
METRIC RATING
55th/ 347
METRIC RANK
2.6%
DOCTORATE DEGREE
100.0/ 100
METRIC RATING
34th/ 347
METRIC RANK
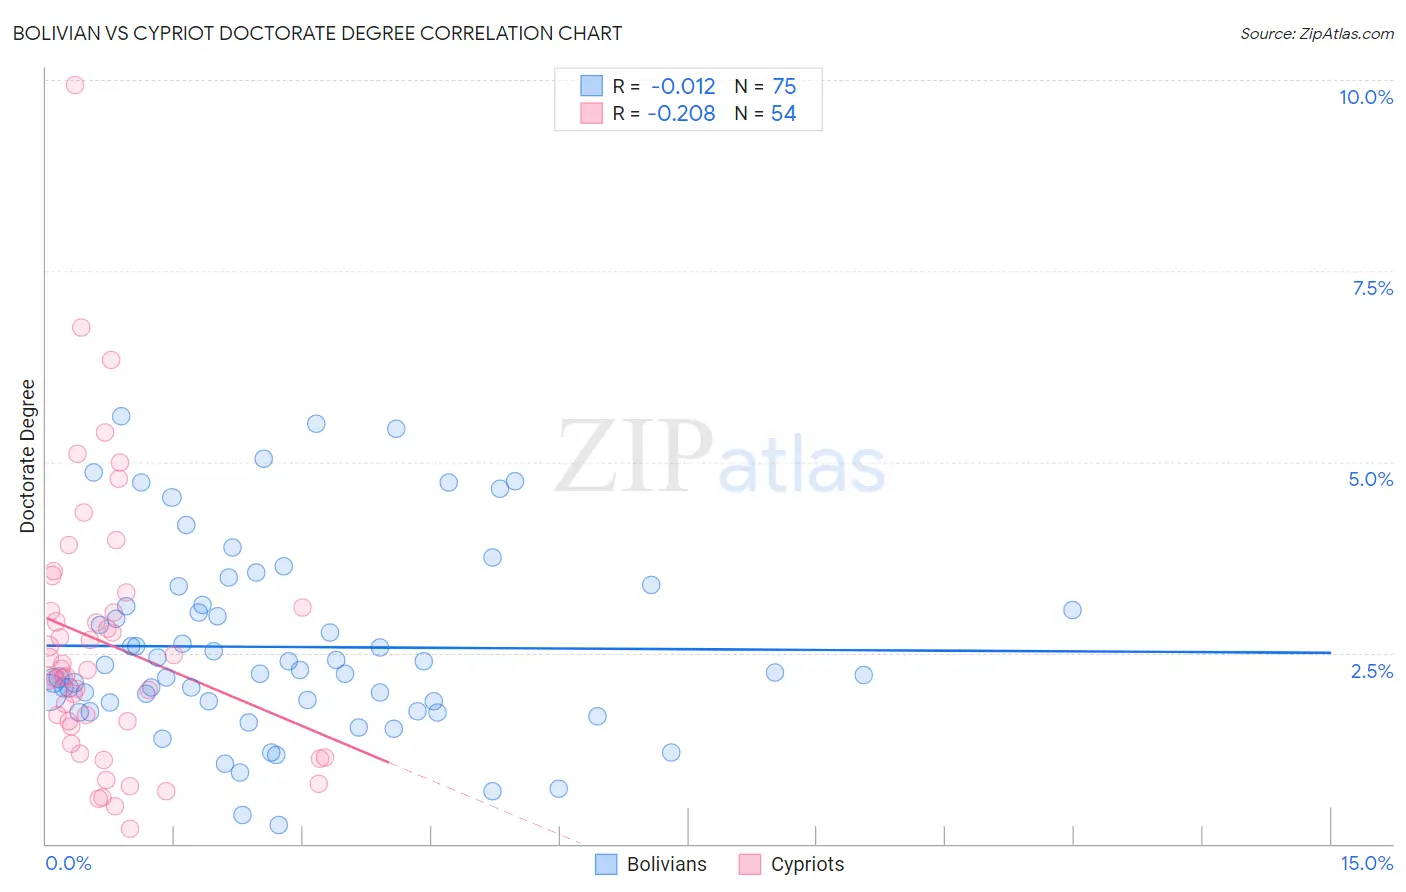
Bolivian vs Cypriot Doctorate Degree Correlation Chart
The statistical analysis conducted on geographies consisting of 184,113,611 people shows no correlation between the proportion of Bolivians and percentage of population with at least doctorate degree education in the United States with a correlation coefficient (R) of -0.012 and weighted average of 2.4%. Similarly, the statistical analysis conducted on geographies consisting of 61,785,676 people shows a weak negative correlation between the proportion of Cypriots and percentage of population with at least doctorate degree education in the United States with a correlation coefficient (R) of -0.208 and weighted average of 2.6%, a difference of 8.5%.
Doctorate Degree Correlation Summary
| Measurement | Bolivian | Cypriot |
| Minimum | 0.25% | 0.20% |
| Maximum | 5.6% | 9.9% |
| Range | 5.3% | 9.7% |
| Mean | 2.6% | 2.6% |
| Median | 2.2% | 2.3% |
| Interquartile 25% (IQ1) | 1.8% | 1.5% |
| Interquartile 75% (IQ3) | 3.1% | 3.1% |
| Interquartile Range (IQR) | 1.3% | 1.6% |
| Standard Deviation (Sample) | 1.2% | 1.8% |
| Standard Deviation (Population) | 1.2% | 1.8% |
Similar Demographics by Doctorate Degree
Demographics Similar to Bolivians by Doctorate Degree
In terms of doctorate degree, the demographic groups most similar to Bolivians are Immigrants from Indonesia (2.4%, a difference of 0.080%), Immigrants from Czechoslovakia (2.4%, a difference of 0.090%), Immigrants from Ethiopia (2.4%, a difference of 0.53%), Ethiopian (2.3%, a difference of 0.65%), and Immigrants from Latvia (2.4%, a difference of 0.76%).
| Demographics | Rating | Rank | Doctorate Degree |
| Asians | 100.0 /100 | #48 | Exceptional 2.4% |
| Immigrants | Asia | 100.0 /100 | #49 | Exceptional 2.4% |
| Immigrants | Norway | 100.0 /100 | #50 | Exceptional 2.4% |
| Australians | 100.0 /100 | #51 | Exceptional 2.4% |
| Bulgarians | 100.0 /100 | #52 | Exceptional 2.4% |
| Immigrants | Latvia | 100.0 /100 | #53 | Exceptional 2.4% |
| Immigrants | Indonesia | 100.0 /100 | #54 | Exceptional 2.4% |
| Bolivians | 100.0 /100 | #55 | Exceptional 2.4% |
| Immigrants | Czechoslovakia | 100.0 /100 | #56 | Exceptional 2.4% |
| Immigrants | Ethiopia | 100.0 /100 | #57 | Exceptional 2.4% |
| Ethiopians | 99.9 /100 | #58 | Exceptional 2.3% |
| South Africans | 99.9 /100 | #59 | Exceptional 2.3% |
| Immigrants | Serbia | 99.9 /100 | #60 | Exceptional 2.3% |
| Bhutanese | 99.9 /100 | #61 | Exceptional 2.3% |
| Immigrants | Europe | 99.9 /100 | #62 | Exceptional 2.3% |
Demographics Similar to Cypriots by Doctorate Degree
In terms of doctorate degree, the demographic groups most similar to Cypriots are Immigrants from Malaysia (2.6%, a difference of 0.060%), Cambodian (2.6%, a difference of 0.11%), Immigrants from Spain (2.6%, a difference of 0.12%), Immigrants from Northern Europe (2.6%, a difference of 0.29%), and Immigrants from Kuwait (2.6%, a difference of 0.38%).
| Demographics | Rating | Rank | Doctorate Degree |
| Immigrants | Turkey | 100.0 /100 | #27 | Exceptional 2.6% |
| Burmese | 100.0 /100 | #28 | Exceptional 2.6% |
| Immigrants | South Central Asia | 100.0 /100 | #29 | Exceptional 2.6% |
| Immigrants | Korea | 100.0 /100 | #30 | Exceptional 2.6% |
| Latvians | 100.0 /100 | #31 | Exceptional 2.6% |
| Immigrants | Northern Europe | 100.0 /100 | #32 | Exceptional 2.6% |
| Cambodians | 100.0 /100 | #33 | Exceptional 2.6% |
| Cypriots | 100.0 /100 | #34 | Exceptional 2.6% |
| Immigrants | Malaysia | 100.0 /100 | #35 | Exceptional 2.6% |
| Immigrants | Spain | 100.0 /100 | #36 | Exceptional 2.6% |
| Immigrants | Kuwait | 100.0 /100 | #37 | Exceptional 2.6% |
| Russians | 100.0 /100 | #38 | Exceptional 2.6% |
| Immigrants | Ireland | 100.0 /100 | #39 | Exceptional 2.5% |
| Estonians | 100.0 /100 | #40 | Exceptional 2.5% |
| Immigrants | Russia | 100.0 /100 | #41 | Exceptional 2.5% |