Bolivian vs Immigrants from China 3rd Grade
COMPARE
Bolivian
Immigrants from China
3rd Grade
3rd Grade Comparison
Bolivians
Immigrants from China
97.3%
3RD GRADE
0.6/ 100
METRIC RATING
255th/ 347
METRIC RANK
97.2%
3RD GRADE
0.2/ 100
METRIC RATING
270th/ 347
METRIC RANK
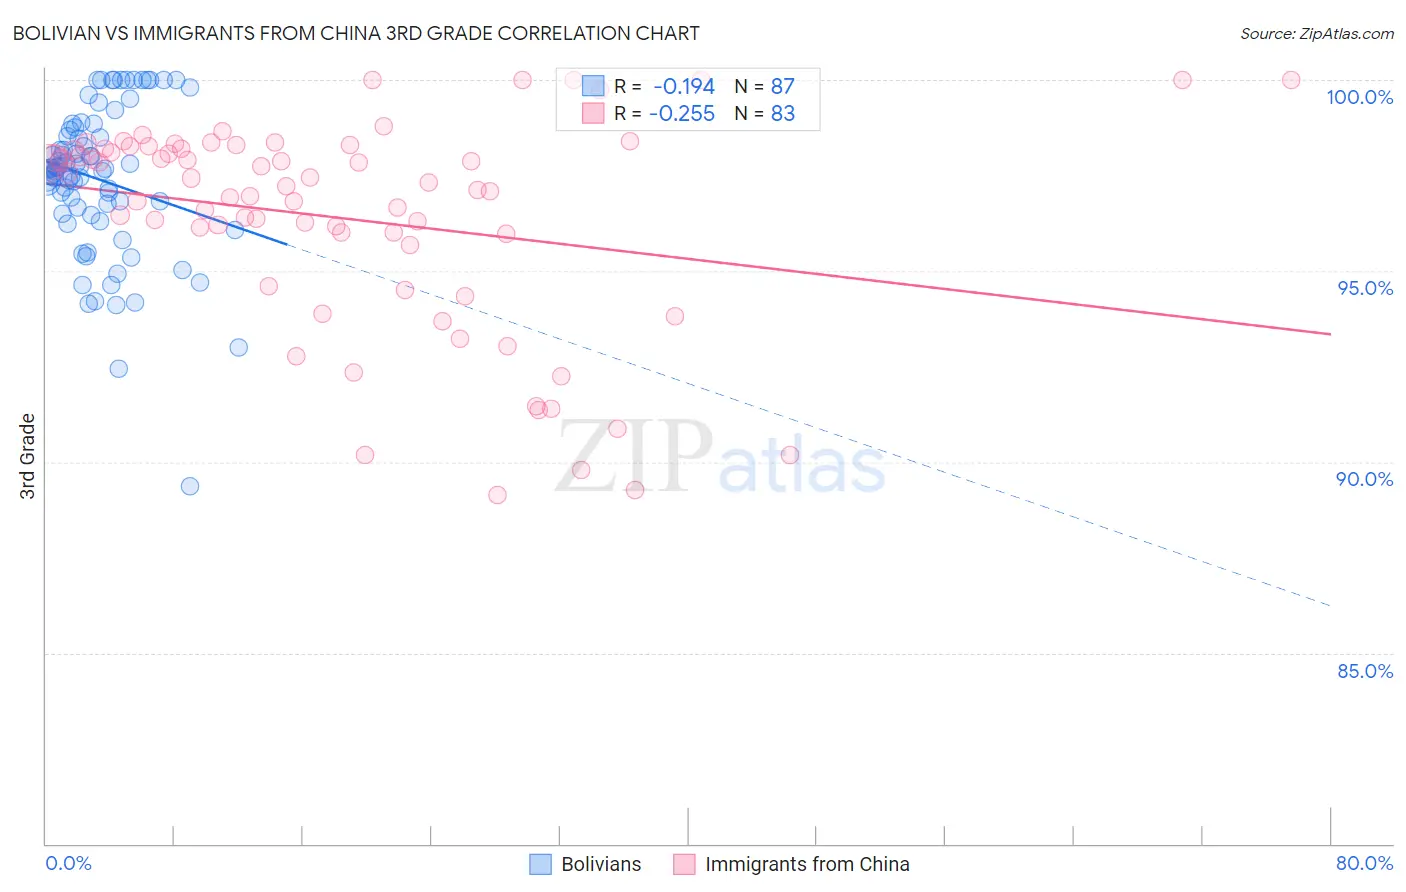
Bolivian vs Immigrants from China 3rd Grade Correlation Chart
The statistical analysis conducted on geographies consisting of 184,667,361 people shows a poor negative correlation between the proportion of Bolivians and percentage of population with at least 3rd grade education in the United States with a correlation coefficient (R) of -0.194 and weighted average of 97.3%. Similarly, the statistical analysis conducted on geographies consisting of 457,082,957 people shows a weak negative correlation between the proportion of Immigrants from China and percentage of population with at least 3rd grade education in the United States with a correlation coefficient (R) of -0.255 and weighted average of 97.2%, a difference of 0.11%.
3rd Grade Correlation Summary
| Measurement | Bolivian | Immigrants from China |
| Minimum | 89.3% | 89.1% |
| Maximum | 100.0% | 100.0% |
| Range | 10.7% | 10.9% |
| Mean | 97.4% | 96.4% |
| Median | 97.7% | 97.2% |
| Interquartile 25% (IQ1) | 96.5% | 95.7% |
| Interquartile 75% (IQ3) | 98.7% | 98.2% |
| Interquartile Range (IQR) | 2.2% | 2.5% |
| Standard Deviation (Sample) | 2.0% | 2.8% |
| Standard Deviation (Population) | 2.0% | 2.7% |
Demographics Similar to Bolivians and Immigrants from China by 3rd Grade
In terms of 3rd grade, the demographic groups most similar to Bolivians are Immigrants from Congo (97.3%, a difference of 0.0%), Immigrants from Colombia (97.3%, a difference of 0.010%), Jamaican (97.4%, a difference of 0.020%), Immigrants from Liberia (97.3%, a difference of 0.020%), and Peruvian (97.4%, a difference of 0.030%). Similarly, the demographic groups most similar to Immigrants from China are Puerto Rican (97.2%, a difference of 0.010%), Ghanaian (97.2%, a difference of 0.010%), Cuban (97.3%, a difference of 0.030%), Fijian (97.3%, a difference of 0.030%), and Yaqui (97.3%, a difference of 0.040%).
| Demographics | Rating | Rank | 3rd Grade |
| Peruvians | 0.8 /100 | #252 | Tragic 97.4% |
| Immigrants | Africa | 0.8 /100 | #253 | Tragic 97.4% |
| Jamaicans | 0.7 /100 | #254 | Tragic 97.4% |
| Bolivians | 0.6 /100 | #255 | Tragic 97.3% |
| Immigrants | Congo | 0.6 /100 | #256 | Tragic 97.3% |
| Immigrants | Colombia | 0.5 /100 | #257 | Tragic 97.3% |
| Immigrants | Liberia | 0.5 /100 | #258 | Tragic 97.3% |
| Armenians | 0.4 /100 | #259 | Tragic 97.3% |
| Immigrants | Ethiopia | 0.4 /100 | #260 | Tragic 97.3% |
| Immigrants | South America | 0.4 /100 | #261 | Tragic 97.3% |
| Immigrants | Sierra Leone | 0.4 /100 | #262 | Tragic 97.3% |
| Taiwanese | 0.3 /100 | #263 | Tragic 97.3% |
| West Indians | 0.3 /100 | #264 | Tragic 97.3% |
| Immigrants | Jamaica | 0.3 /100 | #265 | Tragic 97.3% |
| Yaqui | 0.3 /100 | #266 | Tragic 97.3% |
| Immigrants | Nigeria | 0.3 /100 | #267 | Tragic 97.3% |
| Cubans | 0.2 /100 | #268 | Tragic 97.3% |
| Fijians | 0.2 /100 | #269 | Tragic 97.3% |
| Immigrants | China | 0.2 /100 | #270 | Tragic 97.2% |
| Puerto Ricans | 0.2 /100 | #271 | Tragic 97.2% |
| Ghanaians | 0.1 /100 | #272 | Tragic 97.2% |