Bolivian vs Yugoslavian 3rd Grade
COMPARE
Bolivian
Yugoslavian
3rd Grade
3rd Grade Comparison
Bolivians
Yugoslavians
97.3%
3RD GRADE
0.6/ 100
METRIC RATING
255th/ 347
METRIC RANK
98.1%
3RD GRADE
97.7/ 100
METRIC RATING
103rd/ 347
METRIC RANK
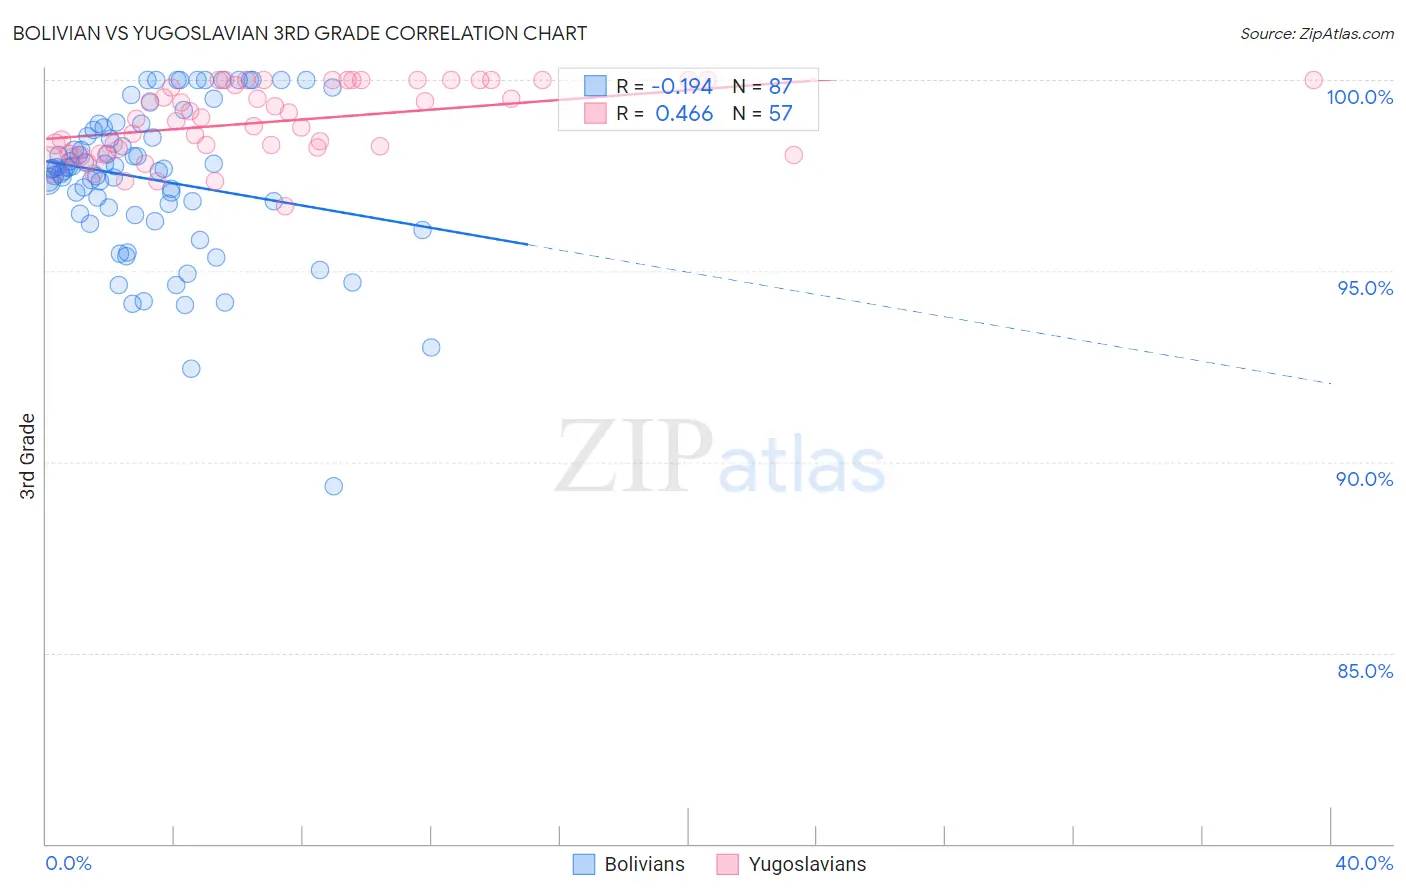
Bolivian vs Yugoslavian 3rd Grade Correlation Chart
The statistical analysis conducted on geographies consisting of 184,667,361 people shows a poor negative correlation between the proportion of Bolivians and percentage of population with at least 3rd grade education in the United States with a correlation coefficient (R) of -0.194 and weighted average of 97.3%. Similarly, the statistical analysis conducted on geographies consisting of 285,616,282 people shows a moderate positive correlation between the proportion of Yugoslavians and percentage of population with at least 3rd grade education in the United States with a correlation coefficient (R) of 0.466 and weighted average of 98.1%, a difference of 0.75%.
3rd Grade Correlation Summary
| Measurement | Bolivian | Yugoslavian |
| Minimum | 89.3% | 96.7% |
| Maximum | 100.0% | 100.0% |
| Range | 10.7% | 3.3% |
| Mean | 97.4% | 98.9% |
| Median | 97.7% | 99.0% |
| Interquartile 25% (IQ1) | 96.5% | 98.1% |
| Interquartile 75% (IQ3) | 98.7% | 100.0% |
| Interquartile Range (IQR) | 2.2% | 1.9% |
| Standard Deviation (Sample) | 2.0% | 0.93% |
| Standard Deviation (Population) | 2.0% | 0.92% |
Similar Demographics by 3rd Grade
Demographics Similar to Bolivians by 3rd Grade
In terms of 3rd grade, the demographic groups most similar to Bolivians are Immigrants from Congo (97.3%, a difference of 0.0%), Immigrants from Colombia (97.3%, a difference of 0.010%), Jamaican (97.4%, a difference of 0.020%), Immigrants from Liberia (97.3%, a difference of 0.020%), and Immigrants from Middle Africa (97.4%, a difference of 0.030%).
| Demographics | Rating | Rank | 3rd Grade |
| Immigrants | Eastern Africa | 0.9 /100 | #248 | Tragic 97.4% |
| South Americans | 0.9 /100 | #249 | Tragic 97.4% |
| Immigrants | Middle Africa | 0.9 /100 | #250 | Tragic 97.4% |
| Immigrants | Asia | 0.8 /100 | #251 | Tragic 97.4% |
| Peruvians | 0.8 /100 | #252 | Tragic 97.4% |
| Immigrants | Africa | 0.8 /100 | #253 | Tragic 97.4% |
| Jamaicans | 0.7 /100 | #254 | Tragic 97.4% |
| Bolivians | 0.6 /100 | #255 | Tragic 97.3% |
| Immigrants | Congo | 0.6 /100 | #256 | Tragic 97.3% |
| Immigrants | Colombia | 0.5 /100 | #257 | Tragic 97.3% |
| Immigrants | Liberia | 0.5 /100 | #258 | Tragic 97.3% |
| Armenians | 0.4 /100 | #259 | Tragic 97.3% |
| Immigrants | Ethiopia | 0.4 /100 | #260 | Tragic 97.3% |
| Immigrants | South America | 0.4 /100 | #261 | Tragic 97.3% |
| Immigrants | Sierra Leone | 0.4 /100 | #262 | Tragic 97.3% |
Demographics Similar to Yugoslavians by 3rd Grade
In terms of 3rd grade, the demographic groups most similar to Yugoslavians are Turkish (98.1%, a difference of 0.0%), Choctaw (98.1%, a difference of 0.010%), Romanian (98.1%, a difference of 0.010%), Cree (98.1%, a difference of 0.010%), and Puget Sound Salish (98.1%, a difference of 0.010%).
| Demographics | Rating | Rank | 3rd Grade |
| Immigrants | Ireland | 98.2 /100 | #96 | Exceptional 98.1% |
| South Africans | 98.2 /100 | #97 | Exceptional 98.1% |
| Choctaw | 98.0 /100 | #98 | Exceptional 98.1% |
| Romanians | 98.0 /100 | #99 | Exceptional 98.1% |
| Cree | 97.9 /100 | #100 | Exceptional 98.1% |
| Puget Sound Salish | 97.9 /100 | #101 | Exceptional 98.1% |
| Immigrants | Nonimmigrants | 97.8 /100 | #102 | Exceptional 98.1% |
| Yugoslavians | 97.7 /100 | #103 | Exceptional 98.1% |
| Turks | 97.6 /100 | #104 | Exceptional 98.1% |
| German Russians | 97.2 /100 | #105 | Exceptional 98.1% |
| Bhutanese | 97.2 /100 | #106 | Exceptional 98.1% |
| Immigrants | Czechoslovakia | 97.0 /100 | #107 | Exceptional 98.0% |
| Immigrants | Singapore | 96.7 /100 | #108 | Exceptional 98.0% |
| Pima | 96.7 /100 | #109 | Exceptional 98.0% |
| Immigrants | Switzerland | 96.6 /100 | #110 | Exceptional 98.0% |