Immigrants from Lebanon vs Israeli Nursery School
COMPARE
Immigrants from Lebanon
Israeli
Nursery School
Nursery School Comparison
Immigrants from Lebanon
Israelis
97.9%
NURSERY SCHOOL
21.2/ 100
METRIC RATING
201st/ 347
METRIC RANK
98.1%
NURSERY SCHOOL
88.2/ 100
METRIC RATING
137th/ 347
METRIC RANK
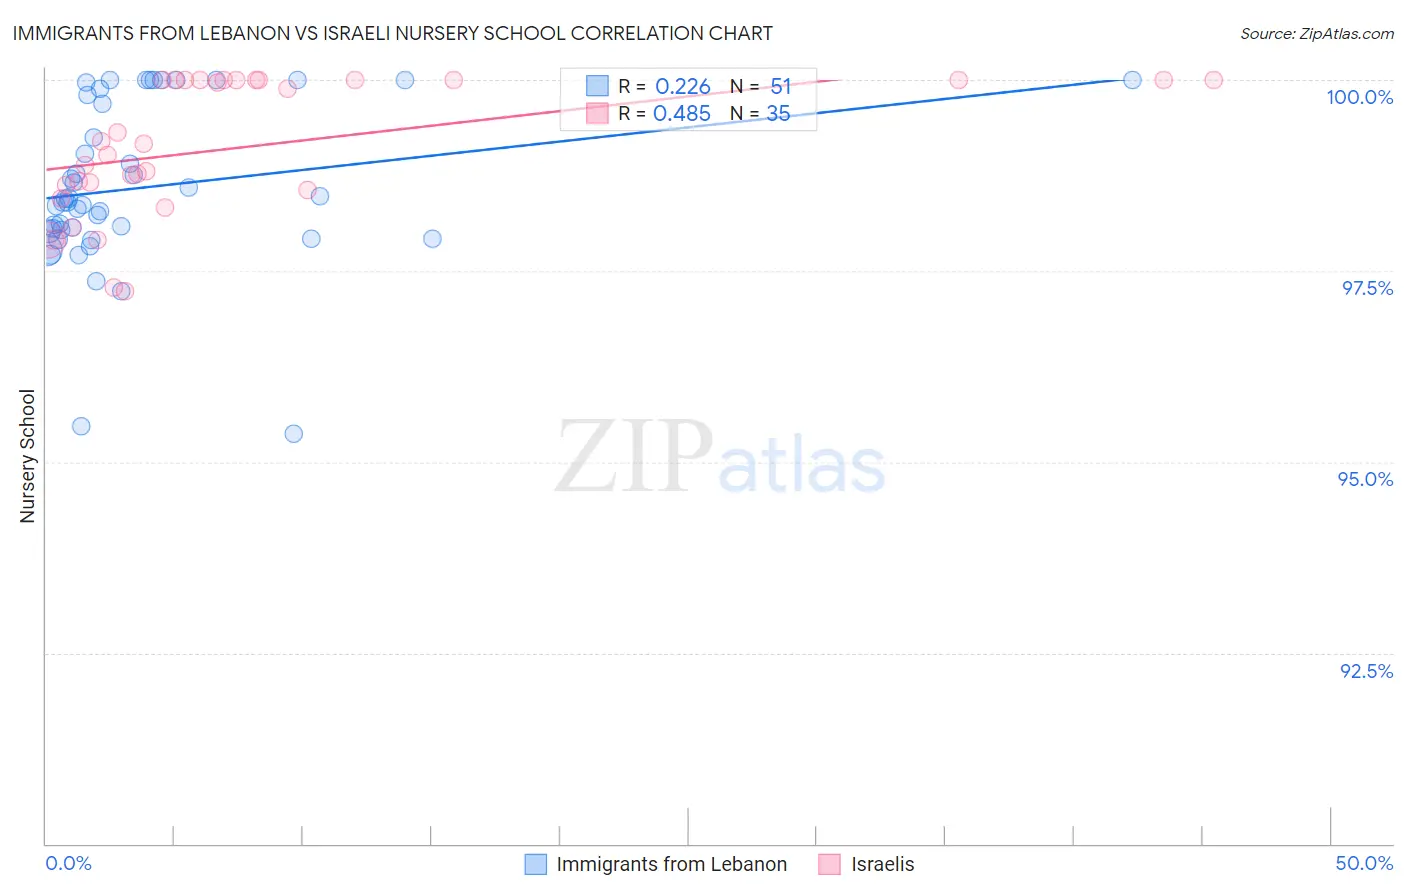
Immigrants from Lebanon vs Israeli Nursery School Correlation Chart
The statistical analysis conducted on geographies consisting of 217,102,284 people shows a weak positive correlation between the proportion of Immigrants from Lebanon and percentage of population with at least nursery school education in the United States with a correlation coefficient (R) of 0.226 and weighted average of 97.9%. Similarly, the statistical analysis conducted on geographies consisting of 211,219,690 people shows a moderate positive correlation between the proportion of Israelis and percentage of population with at least nursery school education in the United States with a correlation coefficient (R) of 0.485 and weighted average of 98.1%, a difference of 0.25%.
Nursery School Correlation Summary
| Measurement | Immigrants from Lebanon | Israeli |
| Minimum | 95.4% | 97.2% |
| Maximum | 100.0% | 100.0% |
| Range | 4.6% | 2.8% |
| Mean | 98.6% | 99.1% |
| Median | 98.4% | 99.2% |
| Interquartile 25% (IQ1) | 98.0% | 98.6% |
| Interquartile 75% (IQ3) | 99.8% | 100.0% |
| Interquartile Range (IQR) | 1.8% | 1.4% |
| Standard Deviation (Sample) | 1.1% | 0.88% |
| Standard Deviation (Population) | 1.1% | 0.87% |
Similar Demographics by Nursery School
Demographics Similar to Immigrants from Lebanon by Nursery School
In terms of nursery school, the demographic groups most similar to Immigrants from Lebanon are Tohono O'odham (97.9%, a difference of 0.0%), Immigrants from Kenya (97.9%, a difference of 0.010%), Immigrants from Egypt (97.9%, a difference of 0.010%), Immigrants from Ukraine (97.9%, a difference of 0.010%), and Hawaiian (97.9%, a difference of 0.020%).
| Demographics | Rating | Rank | Nursery School |
| Mongolians | 27.3 /100 | #194 | Fair 97.9% |
| Hawaiians | 27.2 /100 | #195 | Fair 97.9% |
| Guamanians/Chamorros | 25.7 /100 | #196 | Fair 97.9% |
| Yuman | 25.7 /100 | #197 | Fair 97.9% |
| Immigrants | Kenya | 24.1 /100 | #198 | Fair 97.9% |
| Immigrants | Egypt | 22.5 /100 | #199 | Fair 97.9% |
| Tohono O'odham | 22.2 /100 | #200 | Fair 97.9% |
| Immigrants | Lebanon | 21.2 /100 | #201 | Fair 97.9% |
| Immigrants | Ukraine | 19.9 /100 | #202 | Poor 97.9% |
| Immigrants | Uganda | 18.0 /100 | #203 | Poor 97.9% |
| Immigrants | Southern Europe | 17.4 /100 | #204 | Poor 97.9% |
| Immigrants | Chile | 17.3 /100 | #205 | Poor 97.9% |
| Immigrants | Albania | 16.4 /100 | #206 | Poor 97.9% |
| Africans | 15.4 /100 | #207 | Poor 97.9% |
| Immigrants | Northern Africa | 11.7 /100 | #208 | Poor 97.8% |
Demographics Similar to Israelis by Nursery School
In terms of nursery school, the demographic groups most similar to Israelis are Immigrants from Romania (98.1%, a difference of 0.0%), Blackfeet (98.1%, a difference of 0.0%), Immigrants from Bulgaria (98.1%, a difference of 0.010%), Immigrants from Hungary (98.1%, a difference of 0.010%), and Immigrants from Kuwait (98.1%, a difference of 0.010%).
| Demographics | Rating | Rank | Nursery School |
| Immigrants | Croatia | 91.4 /100 | #130 | Exceptional 98.2% |
| Spaniards | 91.1 /100 | #131 | Exceptional 98.2% |
| Seminole | 90.9 /100 | #132 | Exceptional 98.2% |
| Immigrants | Europe | 90.7 /100 | #133 | Exceptional 98.1% |
| Immigrants | Bulgaria | 89.4 /100 | #134 | Excellent 98.1% |
| Immigrants | Hungary | 89.3 /100 | #135 | Excellent 98.1% |
| Immigrants | Kuwait | 88.9 /100 | #136 | Excellent 98.1% |
| Israelis | 88.2 /100 | #137 | Excellent 98.1% |
| Immigrants | Romania | 88.0 /100 | #138 | Excellent 98.1% |
| Blackfeet | 87.5 /100 | #139 | Excellent 98.1% |
| Palestinians | 83.7 /100 | #140 | Excellent 98.1% |
| Immigrants | Turkey | 83.0 /100 | #141 | Excellent 98.1% |
| Burmese | 81.7 /100 | #142 | Excellent 98.1% |
| Marshallese | 81.2 /100 | #143 | Excellent 98.1% |
| Alsatians | 80.3 /100 | #144 | Excellent 98.1% |