British vs Immigrants from Brazil 3rd Grade
COMPARE
British
Immigrants from Brazil
3rd Grade
3rd Grade Comparison
British
Immigrants from Brazil
98.4%
3RD GRADE
99.9/ 100
METRIC RATING
36th/ 347
METRIC RANK
97.7%
3RD GRADE
46.4/ 100
METRIC RATING
178th/ 347
METRIC RANK
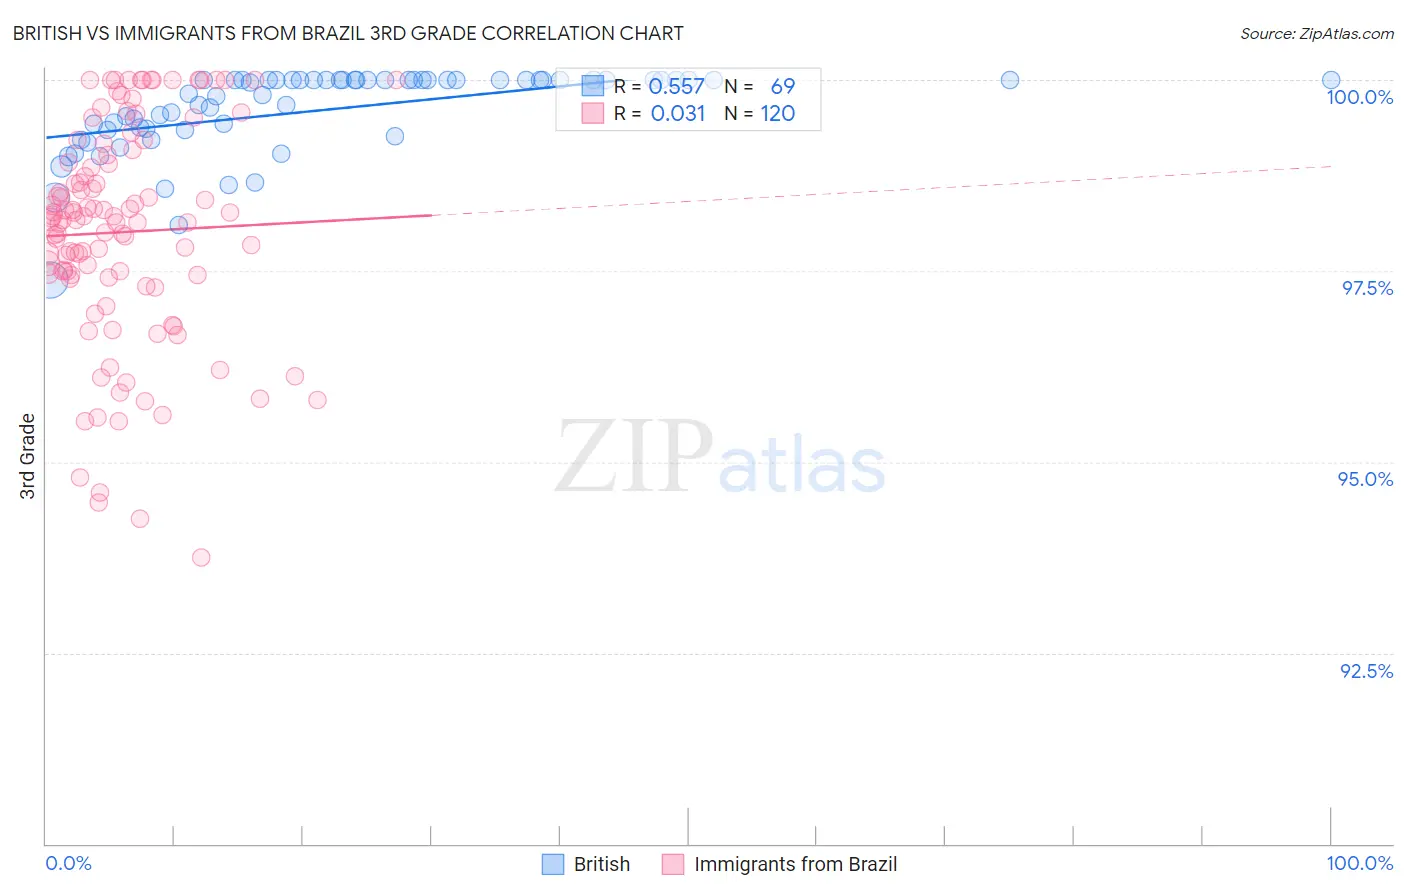
British vs Immigrants from Brazil 3rd Grade Correlation Chart
The statistical analysis conducted on geographies consisting of 531,462,526 people shows a substantial positive correlation between the proportion of British and percentage of population with at least 3rd grade education in the United States with a correlation coefficient (R) of 0.557 and weighted average of 98.4%. Similarly, the statistical analysis conducted on geographies consisting of 343,021,580 people shows no correlation between the proportion of Immigrants from Brazil and percentage of population with at least 3rd grade education in the United States with a correlation coefficient (R) of 0.031 and weighted average of 97.7%, a difference of 0.65%.
3rd Grade Correlation Summary
| Measurement | British | Immigrants from Brazil |
| Minimum | 97.4% | 93.7% |
| Maximum | 100.0% | 100.0% |
| Range | 2.6% | 6.3% |
| Mean | 99.6% | 98.0% |
| Median | 100.0% | 98.2% |
| Interquartile 25% (IQ1) | 99.3% | 97.4% |
| Interquartile 75% (IQ3) | 100.0% | 99.0% |
| Interquartile Range (IQR) | 0.65% | 1.5% |
| Standard Deviation (Sample) | 0.55% | 1.4% |
| Standard Deviation (Population) | 0.54% | 1.4% |
Similar Demographics by 3rd Grade
Demographics Similar to British by 3rd Grade
In terms of 3rd grade, the demographic groups most similar to British are Arapaho (98.4%, a difference of 0.010%), Italian (98.4%, a difference of 0.010%), Chippewa (98.4%, a difference of 0.010%), Chinese (98.4%, a difference of 0.020%), and Swiss (98.4%, a difference of 0.020%).
| Demographics | Rating | Rank | 3rd Grade |
| French Canadians | 100.0 /100 | #29 | Exceptional 98.4% |
| Europeans | 100.0 /100 | #30 | Exceptional 98.4% |
| Czechs | 100.0 /100 | #31 | Exceptional 98.4% |
| Scandinavians | 100.0 /100 | #32 | Exceptional 98.4% |
| Chinese | 100.0 /100 | #33 | Exceptional 98.4% |
| Swiss | 100.0 /100 | #34 | Exceptional 98.4% |
| Arapaho | 100.0 /100 | #35 | Exceptional 98.4% |
| British | 99.9 /100 | #36 | Exceptional 98.4% |
| Italians | 99.9 /100 | #37 | Exceptional 98.4% |
| Chippewa | 99.9 /100 | #38 | Exceptional 98.4% |
| Latvians | 99.9 /100 | #39 | Exceptional 98.4% |
| Eastern Europeans | 99.9 /100 | #40 | Exceptional 98.3% |
| Luxembourgers | 99.9 /100 | #41 | Exceptional 98.3% |
| Belgians | 99.9 /100 | #42 | Exceptional 98.3% |
| Northern Europeans | 99.9 /100 | #43 | Exceptional 98.3% |
Demographics Similar to Immigrants from Brazil by 3rd Grade
In terms of 3rd grade, the demographic groups most similar to Immigrants from Brazil are Immigrants from Micronesia (97.8%, a difference of 0.0%), Immigrants from Poland (97.8%, a difference of 0.0%), Egyptian (97.7%, a difference of 0.0%), Immigrants from Belarus (97.7%, a difference of 0.0%), and Immigrants from Sri Lanka (97.7%, a difference of 0.0%).
| Demographics | Rating | Rank | 3rd Grade |
| Kenyans | 51.8 /100 | #171 | Average 97.8% |
| Spanish Americans | 51.8 /100 | #172 | Average 97.8% |
| Immigrants | Korea | 50.9 /100 | #173 | Average 97.8% |
| Navajo | 50.0 /100 | #174 | Average 97.8% |
| Immigrants | Micronesia | 47.6 /100 | #175 | Average 97.8% |
| Immigrants | Poland | 47.1 /100 | #176 | Average 97.8% |
| Egyptians | 46.6 /100 | #177 | Average 97.7% |
| Immigrants | Brazil | 46.4 /100 | #178 | Average 97.7% |
| Immigrants | Belarus | 45.9 /100 | #179 | Average 97.7% |
| Immigrants | Sri Lanka | 45.1 /100 | #180 | Average 97.7% |
| Immigrants | Venezuela | 44.4 /100 | #181 | Average 97.7% |
| Argentineans | 42.9 /100 | #182 | Average 97.7% |
| Arabs | 40.0 /100 | #183 | Fair 97.7% |
| Immigrants | Kazakhstan | 37.4 /100 | #184 | Fair 97.7% |
| Immigrants | Argentina | 37.0 /100 | #185 | Fair 97.7% |