Czech vs Afghan 7th Grade
COMPARE
Czech
Afghan
7th Grade
7th Grade Comparison
Czechs
Afghans
97.4%
7TH GRADE
100.0/ 100
METRIC RATING
30th/ 347
METRIC RANK
95.3%
7TH GRADE
0.5/ 100
METRIC RATING
260th/ 347
METRIC RANK
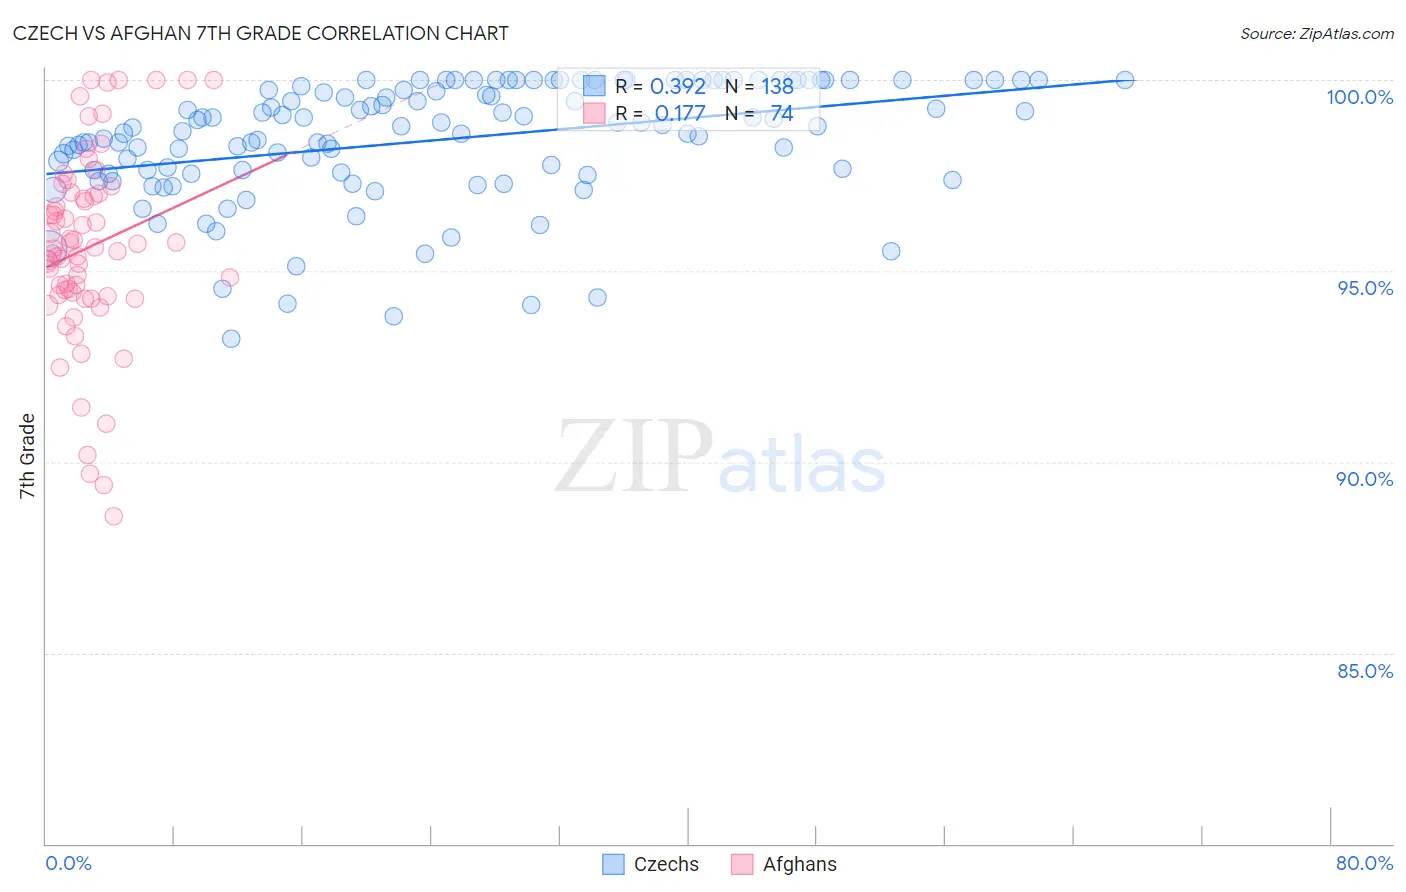
Czech vs Afghan 7th Grade Correlation Chart
The statistical analysis conducted on geographies consisting of 484,805,615 people shows a mild positive correlation between the proportion of Czechs and percentage of population with at least 7th grade education in the United States with a correlation coefficient (R) of 0.392 and weighted average of 97.4%. Similarly, the statistical analysis conducted on geographies consisting of 148,851,685 people shows a poor positive correlation between the proportion of Afghans and percentage of population with at least 7th grade education in the United States with a correlation coefficient (R) of 0.177 and weighted average of 95.3%, a difference of 2.2%.
7th Grade Correlation Summary
| Measurement | Czech | Afghan |
| Minimum | 93.2% | 88.6% |
| Maximum | 100.0% | 100.0% |
| Range | 6.8% | 11.4% |
| Mean | 98.4% | 95.6% |
| Median | 98.8% | 95.6% |
| Interquartile 25% (IQ1) | 97.6% | 94.4% |
| Interquartile 75% (IQ3) | 100.0% | 97.0% |
| Interquartile Range (IQR) | 2.4% | 2.7% |
| Standard Deviation (Sample) | 1.6% | 2.5% |
| Standard Deviation (Population) | 1.6% | 2.5% |
Similar Demographics by 7th Grade
Demographics Similar to Czechs by 7th Grade
In terms of 7th grade, the demographic groups most similar to Czechs are Sioux (97.4%, a difference of 0.010%), Scandinavian (97.4%, a difference of 0.010%), European (97.3%, a difference of 0.020%), Italian (97.3%, a difference of 0.020%), and Scotch-Irish (97.4%, a difference of 0.030%).
| Demographics | Rating | Rank | 7th Grade |
| Croatians | 100.0 /100 | #23 | Exceptional 97.4% |
| Welsh | 100.0 /100 | #24 | Exceptional 97.4% |
| French | 100.0 /100 | #25 | Exceptional 97.4% |
| Scotch-Irish | 100.0 /100 | #26 | Exceptional 97.4% |
| Danes | 100.0 /100 | #27 | Exceptional 97.4% |
| Sioux | 100.0 /100 | #28 | Exceptional 97.4% |
| Scandinavians | 100.0 /100 | #29 | Exceptional 97.4% |
| Czechs | 100.0 /100 | #30 | Exceptional 97.4% |
| Europeans | 100.0 /100 | #31 | Exceptional 97.3% |
| Italians | 100.0 /100 | #32 | Exceptional 97.3% |
| Chippewa | 100.0 /100 | #33 | Exceptional 97.3% |
| Alaska Natives | 100.0 /100 | #34 | Exceptional 97.3% |
| Swiss | 100.0 /100 | #35 | Exceptional 97.3% |
| Hungarians | 100.0 /100 | #36 | Exceptional 97.2% |
| British | 100.0 /100 | #37 | Exceptional 97.2% |
Demographics Similar to Afghans by 7th Grade
In terms of 7th grade, the demographic groups most similar to Afghans are South American (95.2%, a difference of 0.010%), Immigrants from Somalia (95.2%, a difference of 0.010%), West Indian (95.2%, a difference of 0.010%), Immigrants from Nigeria (95.2%, a difference of 0.020%), and Immigrants from Costa Rica (95.3%, a difference of 0.030%).
| Demographics | Rating | Rank | 7th Grade |
| Somalis | 0.9 /100 | #253 | Tragic 95.3% |
| Colombians | 0.8 /100 | #254 | Tragic 95.3% |
| Koreans | 0.8 /100 | #255 | Tragic 95.3% |
| Immigrants | China | 0.7 /100 | #256 | Tragic 95.3% |
| Immigrants | Congo | 0.7 /100 | #257 | Tragic 95.3% |
| Ghanaians | 0.7 /100 | #258 | Tragic 95.3% |
| Immigrants | Costa Rica | 0.6 /100 | #259 | Tragic 95.3% |
| Afghans | 0.5 /100 | #260 | Tragic 95.3% |
| South Americans | 0.5 /100 | #261 | Tragic 95.2% |
| Immigrants | Somalia | 0.5 /100 | #262 | Tragic 95.2% |
| West Indians | 0.5 /100 | #263 | Tragic 95.2% |
| Immigrants | Nigeria | 0.4 /100 | #264 | Tragic 95.2% |
| Immigrants | Uruguay | 0.3 /100 | #265 | Tragic 95.2% |
| Immigrants | Ghana | 0.3 /100 | #266 | Tragic 95.2% |
| Yuman | 0.3 /100 | #267 | Tragic 95.2% |