Immigrants from St. Vincent and the Grenadines vs Afghan 7th Grade
COMPARE
Immigrants from St. Vincent and the Grenadines
Afghan
7th Grade
7th Grade Comparison
Immigrants from St. Vincent and the Grenadines
Afghans
95.0%
7TH GRADE
0.1/ 100
METRIC RATING
280th/ 347
METRIC RANK
95.3%
7TH GRADE
0.5/ 100
METRIC RATING
260th/ 347
METRIC RANK
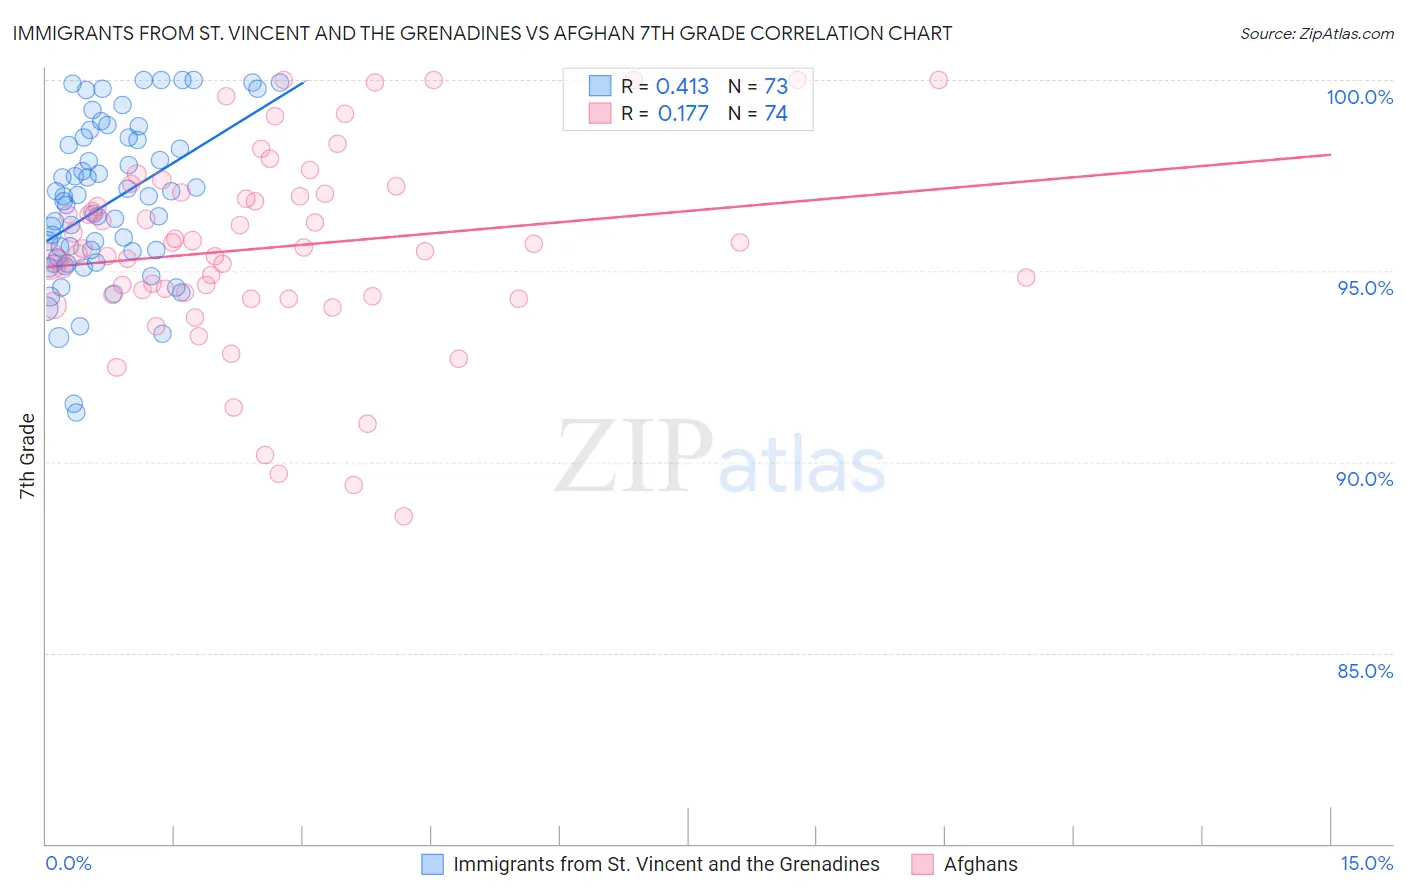
Immigrants from St. Vincent and the Grenadines vs Afghan 7th Grade Correlation Chart
The statistical analysis conducted on geographies consisting of 56,191,418 people shows a moderate positive correlation between the proportion of Immigrants from St. Vincent and the Grenadines and percentage of population with at least 7th grade education in the United States with a correlation coefficient (R) of 0.413 and weighted average of 95.0%. Similarly, the statistical analysis conducted on geographies consisting of 148,851,685 people shows a poor positive correlation between the proportion of Afghans and percentage of population with at least 7th grade education in the United States with a correlation coefficient (R) of 0.177 and weighted average of 95.3%, a difference of 0.24%.
7th Grade Correlation Summary
| Measurement | Immigrants from St. Vincent and the Grenadines | Afghan |
| Minimum | 91.3% | 88.6% |
| Maximum | 100.0% | 100.0% |
| Range | 8.7% | 11.4% |
| Mean | 96.8% | 95.6% |
| Median | 96.8% | 95.6% |
| Interquartile 25% (IQ1) | 95.3% | 94.4% |
| Interquartile 75% (IQ3) | 98.5% | 97.0% |
| Interquartile Range (IQR) | 3.2% | 2.7% |
| Standard Deviation (Sample) | 2.1% | 2.5% |
| Standard Deviation (Population) | 2.1% | 2.5% |
Demographics Similar to Immigrants from St. Vincent and the Grenadines and Afghans by 7th Grade
In terms of 7th grade, the demographic groups most similar to Immigrants from St. Vincent and the Grenadines are Immigrants from Trinidad and Tobago (95.1%, a difference of 0.030%), Barbadian (95.1%, a difference of 0.030%), Immigrants from Afghanistan (95.1%, a difference of 0.070%), Immigrants from Thailand (95.1%, a difference of 0.090%), and Immigrants from Western Africa (95.1%, a difference of 0.11%). Similarly, the demographic groups most similar to Afghans are South American (95.2%, a difference of 0.010%), Immigrants from Somalia (95.2%, a difference of 0.010%), West Indian (95.2%, a difference of 0.010%), Immigrants from Nigeria (95.2%, a difference of 0.020%), and Immigrants from Uruguay (95.2%, a difference of 0.060%).
| Demographics | Rating | Rank | 7th Grade |
| Afghans | 0.5 /100 | #260 | Tragic 95.3% |
| South Americans | 0.5 /100 | #261 | Tragic 95.2% |
| Immigrants | Somalia | 0.5 /100 | #262 | Tragic 95.2% |
| West Indians | 0.5 /100 | #263 | Tragic 95.2% |
| Immigrants | Nigeria | 0.4 /100 | #264 | Tragic 95.2% |
| Immigrants | Uruguay | 0.3 /100 | #265 | Tragic 95.2% |
| Immigrants | Ghana | 0.3 /100 | #266 | Tragic 95.2% |
| Yuman | 0.3 /100 | #267 | Tragic 95.2% |
| Immigrants | Hong Kong | 0.3 /100 | #268 | Tragic 95.2% |
| Trinidadians and Tobagonians | 0.3 /100 | #269 | Tragic 95.2% |
| Houma | 0.2 /100 | #270 | Tragic 95.1% |
| Immigrants | South America | 0.2 /100 | #271 | Tragic 95.1% |
| Peruvians | 0.2 /100 | #272 | Tragic 95.1% |
| Immigrants | Uzbekistan | 0.2 /100 | #273 | Tragic 95.1% |
| Immigrants | Western Africa | 0.2 /100 | #274 | Tragic 95.1% |
| Immigrants | Colombia | 0.2 /100 | #275 | Tragic 95.1% |
| Immigrants | Thailand | 0.2 /100 | #276 | Tragic 95.1% |
| Immigrants | Afghanistan | 0.2 /100 | #277 | Tragic 95.1% |
| Immigrants | Trinidad and Tobago | 0.1 /100 | #278 | Tragic 95.1% |
| Barbadians | 0.1 /100 | #279 | Tragic 95.1% |
| Immigrants | St. Vincent and the Grenadines | 0.1 /100 | #280 | Tragic 95.0% |