Blackfeet vs French American Indian Unemployment Among Women with Children Ages 6 to 17 years
COMPARE
Blackfeet
French American Indian
Unemployment Among Women with Children Ages 6 to 17 years
Unemployment Among Women with Children Ages 6 to 17 years Comparison
Blackfeet
French American Indians
9.6%
UNEMPLOYMENT AMONG WOMEN WITH CHILDREN AGES 6 TO 17 YEARS
0.2/ 100
METRIC RATING
269th/ 347
METRIC RANK
9.3%
UNEMPLOYMENT AMONG WOMEN WITH CHILDREN AGES 6 TO 17 YEARS
3.7/ 100
METRIC RATING
232nd/ 347
METRIC RANK
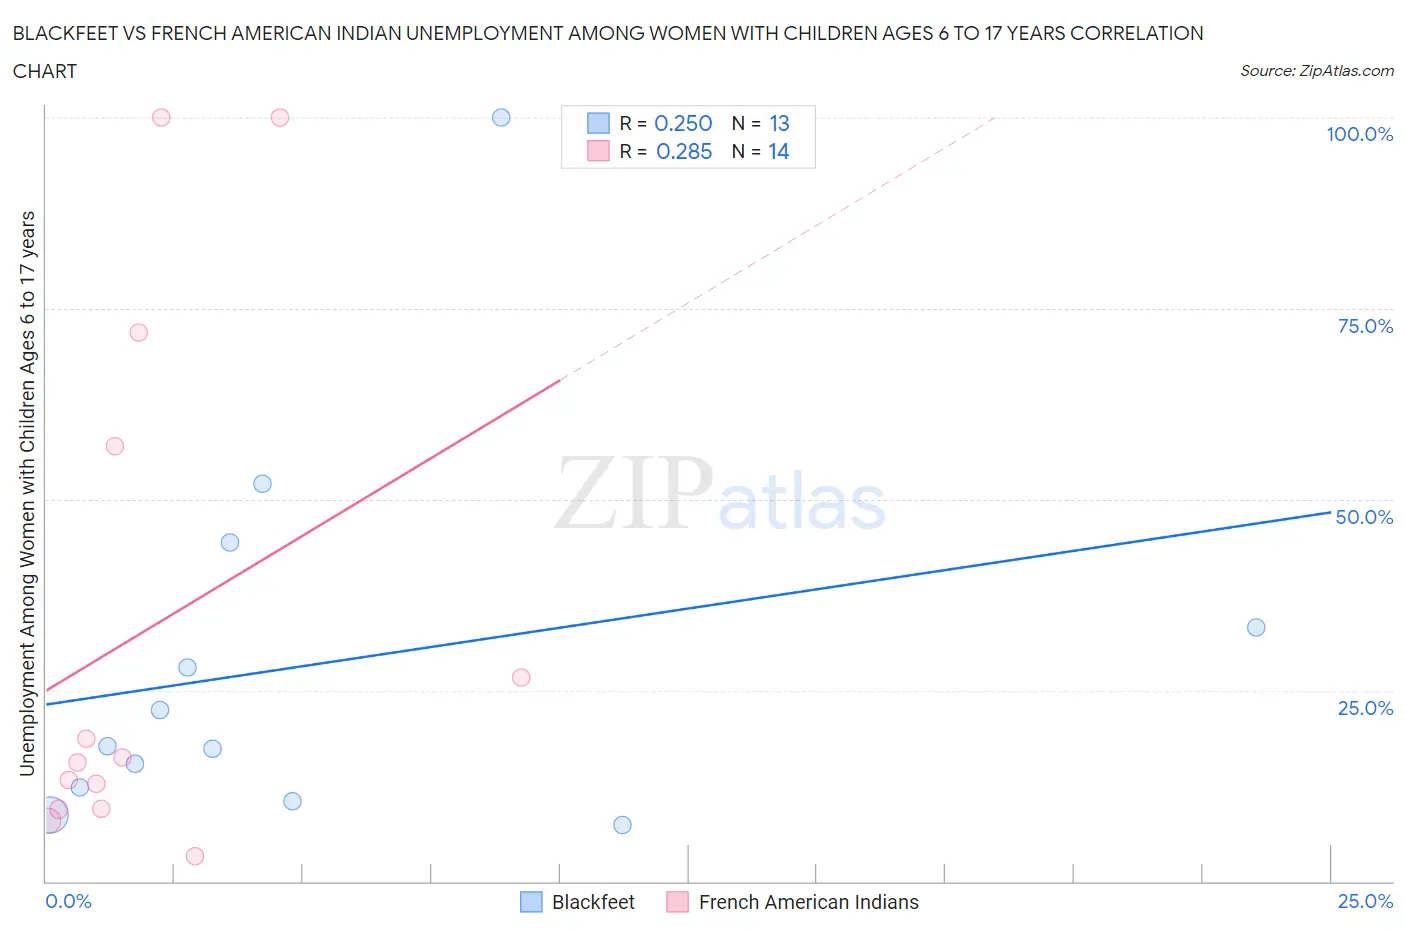
Blackfeet vs French American Indian Unemployment Among Women with Children Ages 6 to 17 years Correlation Chart
The statistical analysis conducted on geographies consisting of 237,122,541 people shows a weak positive correlation between the proportion of Blackfeet and unemployment rate among women with children between the ages 6 and 17 in the United States with a correlation coefficient (R) of 0.250 and weighted average of 9.6%. Similarly, the statistical analysis conducted on geographies consisting of 110,313,886 people shows a weak positive correlation between the proportion of French American Indians and unemployment rate among women with children between the ages 6 and 17 in the United States with a correlation coefficient (R) of 0.285 and weighted average of 9.3%, a difference of 3.2%.
Unemployment Among Women with Children Ages 6 to 17 years Correlation Summary
| Measurement | Blackfeet | French American Indian |
| Minimum | 7.4% | 3.2% |
| Maximum | 100.0% | 100.0% |
| Range | 92.6% | 96.8% |
| Mean | 28.4% | 33.0% |
| Median | 17.6% | 15.9% |
| Interquartile 25% (IQ1) | 11.4% | 9.6% |
| Interquartile 75% (IQ3) | 38.8% | 57.0% |
| Interquartile Range (IQR) | 27.5% | 47.5% |
| Standard Deviation (Sample) | 25.5% | 34.3% |
| Standard Deviation (Population) | 24.5% | 33.1% |
Similar Demographics by Unemployment Among Women with Children Ages 6 to 17 years
Demographics Similar to Blackfeet by Unemployment Among Women with Children Ages 6 to 17 years
In terms of unemployment among women with children ages 6 to 17 years, the demographic groups most similar to Blackfeet are Ghanaian (9.6%, a difference of 0.080%), Immigrants from Nicaragua (9.6%, a difference of 0.10%), Irish (9.5%, a difference of 0.47%), Immigrants from Jamaica (9.5%, a difference of 0.49%), and Immigrants from Latin America (9.6%, a difference of 0.50%).
| Demographics | Rating | Rank | Unemployment Among Women with Children Ages 6 to 17 years |
| Senegalese | 0.5 /100 | #262 | Tragic 9.5% |
| Lebanese | 0.5 /100 | #263 | Tragic 9.5% |
| Immigrants | Ghana | 0.4 /100 | #264 | Tragic 9.5% |
| West Indians | 0.4 /100 | #265 | Tragic 9.5% |
| Immigrants | Jamaica | 0.3 /100 | #266 | Tragic 9.5% |
| Irish | 0.3 /100 | #267 | Tragic 9.5% |
| Ghanaians | 0.2 /100 | #268 | Tragic 9.6% |
| Blackfeet | 0.2 /100 | #269 | Tragic 9.6% |
| Immigrants | Nicaragua | 0.2 /100 | #270 | Tragic 9.6% |
| Immigrants | Latin America | 0.1 /100 | #271 | Tragic 9.6% |
| Kiowa | 0.1 /100 | #272 | Tragic 9.6% |
| Whites/Caucasians | 0.1 /100 | #273 | Tragic 9.6% |
| Aleuts | 0.1 /100 | #274 | Tragic 9.6% |
| U.S. Virgin Islanders | 0.1 /100 | #275 | Tragic 9.7% |
| Immigrants | Portugal | 0.1 /100 | #276 | Tragic 9.7% |
Demographics Similar to French American Indians by Unemployment Among Women with Children Ages 6 to 17 years
In terms of unemployment among women with children ages 6 to 17 years, the demographic groups most similar to French American Indians are Macedonian (9.3%, a difference of 0.060%), Welsh (9.3%, a difference of 0.070%), Immigrants from St. Vincent and the Grenadines (9.3%, a difference of 0.12%), Mexican (9.3%, a difference of 0.15%), and Lumbee (9.3%, a difference of 0.17%).
| Demographics | Rating | Rank | Unemployment Among Women with Children Ages 6 to 17 years |
| Chinese | 5.2 /100 | #225 | Tragic 9.3% |
| Immigrants | Azores | 4.6 /100 | #226 | Tragic 9.3% |
| Panamanians | 4.5 /100 | #227 | Tragic 9.3% |
| Estonians | 4.4 /100 | #228 | Tragic 9.3% |
| Lumbee | 4.3 /100 | #229 | Tragic 9.3% |
| Welsh | 4.0 /100 | #230 | Tragic 9.3% |
| Macedonians | 3.9 /100 | #231 | Tragic 9.3% |
| French American Indians | 3.7 /100 | #232 | Tragic 9.3% |
| Immigrants | St. Vincent and the Grenadines | 3.3 /100 | #233 | Tragic 9.3% |
| Mexicans | 3.2 /100 | #234 | Tragic 9.3% |
| Uruguayans | 3.0 /100 | #235 | Tragic 9.3% |
| Hungarians | 3.0 /100 | #236 | Tragic 9.3% |
| Immigrants | Belize | 2.8 /100 | #237 | Tragic 9.3% |
| Arabs | 2.7 /100 | #238 | Tragic 9.3% |
| Immigrants | Saudi Arabia | 2.7 /100 | #239 | Tragic 9.3% |