Bhutanese vs Immigrants from Iraq Professional Degree

COMPARE

Bhutanese
Race
Ancestry
AfghanAfricanAlaska NativeAlaskan AthabascanAlbanianAleutAlsatianAmericanApacheArabArapahoArgentineanArmenianAssyrian/Chaldean/SyriacAustralianAustrianBahamianBangladeshiBarbadianBasqueBelgianBelizeanBermudanBhutaneseBlackfeetBolivianBrazilianBritishBritish West IndianBulgarianBurmeseCajunCambodianCanadianCape VerdeanCarpatho RusynCelticCentral AmericanCentral American IndianCherokeeCheyenneChickasawChileanChineseChippewaChoctawColombianColvilleComancheCosta RicanCreeCreekCroatianCrowCubanCypriotCzechCzechoslovakianDanishDelawareDominicanDutchDutch West IndianEastern EuropeanEcuadorianEgyptianEnglishEstonianEthiopianEuropeanFijianFilipinoFinnishFrenchFrench American IndianFrench CanadianGermanGerman RussianGhanaianGreekGuamanian/ChamorroGuatemalanGuyaneseHaitianHmongHonduranHopiHoumaHungarianIcelanderIndian (Asian)IndonesianInupiatIranianIraqiIrishIroquoisIsraeliItalianJamaicanJapaneseJordanianKenyanKiowaKoreanLaotianLatvianLebaneseLiberianLithuanianLumbeeLuxembourgerMacedonianMalaysianMalteseMarshalleseMenomineeMexicanMexican American IndianMongolianMoroccanNative HawaiianNavajoNepaleseNew ZealanderNicaraguanNigerianNorthern EuropeanNorwegianOkinawanOsageOttawaPaiutePakistaniPalestinianPanamanianParaguayanPennsylvania GermanPeruvianPimaPolishPortuguesePotawatomiPuebloPuerto RicanPuget Sound SalishRomanianRussianSalvadoranSamoanScandinavianScotch-IrishScottishSeminoleSenegaleseSerbianShoshoneSierra LeoneanSiouxSlavicSlovakSloveneSomaliSouth AfricanSouth AmericanSouth American IndianSoviet UnionSpaniardSpanishSpanish AmericanSpanish American IndianSri LankanSubsaharan AfricanSudaneseSwedishSwissSyrianTaiwaneseThaiTlingit-HaidaTohono O'OdhamTonganTrinidadian and TobagonianTsimshianTurkishU.S. Virgin IslanderUgandanUkrainianUruguayanUteVenezuelanVietnameseWelshWest IndianYakamaYaquiYugoslavianYumanYup'ikZimbabwean
Immigration
NonimmigrantsImmigrantsAfghanistanAfricaAlbaniaArgentinaArmeniaAsiaAustraliaAustriaBahamasBangladeshBarbadosBelarusBelgiumBelizeBoliviaBosnia and HerzegovinaBrazilBulgariaBurma/MyanmarCabo VerdeCambodiaCameroonCanadaCaribbeanCentral AmericaChileChinaColombiaCongoCosta RicaCroatiaCubaCzechoslovakiaDenmarkDominicaDominican RepublicEastern AfricaEastern AsiaEastern EuropeEcuadorEgyptEl SalvadorEnglandEritreaEthiopiaEuropeFijiFranceGermanyGhanaGreeceGrenadaGuatemalaGuyanaHaitiHondurasHong KongHungaryIndiaIndonesiaIranIrelandIsraelItalyJamaicaJapanJordanKazakhstanKenyaKoreaKuwaitLaosLatin AmericaLatviaLebanonLiberiaLithuaniaMalaysiaMexicoMicronesiaMiddle AfricaMoldovaMoroccoNepalNetherlandsNicaraguaNigeriaNorth AmericaNorth MacedoniaNorthern AfricaNorthern EuropeNorwayOceaniaPakistanPanamaPeruPhilippinesPolandPortugalRomaniaRussiaSaudi ArabiaScotlandSenegalSerbiaSierra LeoneSingaporeSomaliaSouth AfricaSouth AmericaSouth Central AsiaSouth Eastern AsiaSouthern EuropeSpainSri LankaSt. Vincent and the GrenadinesSudanSwedenSwitzerlandSyriaTaiwanThailandTrinidad and TobagoTurkeyUgandaUkraineUruguayUzbekistanVenezuelaVietnamWest IndiesWestern AfricaWestern AsiaWestern EuropeYemenZaireZimbabweAzores
Immigrants from Iraq
Race
Ancestry
AfghanAfricanAlaska NativeAlaskan AthabascanAlbanianAleutAlsatianAmericanApacheArabArapahoArgentineanArmenianAssyrian/Chaldean/SyriacAustralianAustrianBahamianBangladeshiBarbadianBasqueBelgianBelizeanBermudanBlackfeetBolivianBrazilianBritishBritish West IndianBulgarianBurmeseCajunCambodianCanadianCape VerdeanCarpatho RusynCelticCentral AmericanCentral American IndianCherokeeCheyenneChickasawChileanChineseChippewaChoctawColombianColvilleComancheCosta RicanCreeCreekCroatianCrowCubanCypriotCzechCzechoslovakianDanishDelawareDominicanDutchDutch West IndianEastern EuropeanEcuadorianEgyptianEnglishEstonianEthiopianEuropeanFijianFilipinoFinnishFrenchFrench American IndianFrench CanadianGermanGerman RussianGhanaianGreekGuamanian/ChamorroGuatemalanGuyaneseHaitianHmongHonduranHopiHoumaHungarianIcelanderIndian (Asian)IndonesianInupiatIranianIraqiIrishIroquoisIsraeliItalianJamaicanJapaneseJordanianKenyanKiowaKoreanLaotianLatvianLebaneseLiberianLithuanianLumbeeLuxembourgerMacedonianMalaysianMalteseMarshalleseMenomineeMexicanMexican American IndianMongolianMoroccanNative HawaiianNavajoNepaleseNew ZealanderNicaraguanNigerianNorthern EuropeanNorwegianOkinawanOsageOttawaPaiutePakistaniPalestinianPanamanianParaguayanPennsylvania GermanPeruvianPimaPolishPortuguesePotawatomiPuebloPuerto RicanPuget Sound SalishRomanianRussianSalvadoranSamoanScandinavianScotch-IrishScottishSeminoleSenegaleseSerbianShoshoneSierra LeoneanSiouxSlavicSlovakSloveneSomaliSouth AfricanSouth AmericanSouth American IndianSoviet UnionSpaniardSpanishSpanish AmericanSpanish American IndianSri LankanSubsaharan AfricanSudaneseSwedishSwissSyrianTaiwaneseThaiTlingit-HaidaTohono O'OdhamTonganTrinidadian and TobagonianTsimshianTurkishU.S. Virgin IslanderUgandanUkrainianUruguayanUteVenezuelanVietnameseWelshWest IndianYakamaYaquiYugoslavianYumanYup'ikZimbabwean
Immigration
NonimmigrantsImmigrantsAfghanistanAfricaAlbaniaArgentinaArmeniaAsiaAustraliaAustriaBahamasBangladeshBarbadosBelarusBelgiumBelizeBoliviaBosnia and HerzegovinaBrazilBulgariaBurma/MyanmarCabo VerdeCambodiaCameroonCanadaCaribbeanCentral AmericaChileChinaColombiaCongoCosta RicaCroatiaCubaCzechoslovakiaDenmarkDominicaDominican RepublicEastern AfricaEastern AsiaEastern EuropeEcuadorEgyptEl SalvadorEnglandEritreaEthiopiaEuropeFijiFranceGermanyGhanaGreeceGrenadaGuatemalaGuyanaHaitiHondurasHong KongHungaryIndiaIndonesiaIranIraqIrelandIsraelItalyJamaicaJapanJordanKazakhstanKenyaKoreaKuwaitLaosLatin AmericaLatviaLebanonLiberiaLithuaniaMalaysiaMexicoMicronesiaMiddle AfricaMoldovaMoroccoNepalNetherlandsNicaraguaNigeriaNorth AmericaNorth MacedoniaNorthern AfricaNorthern EuropeNorwayOceaniaPakistanPanamaPeruPhilippinesPolandPortugalRomaniaRussiaSaudi ArabiaScotlandSenegalSerbiaSierra LeoneSingaporeSomaliaSouth AfricaSouth AmericaSouth Central AsiaSouth Eastern AsiaSouthern EuropeSpainSri LankaSt. Vincent and the GrenadinesSudanSwedenSwitzerlandSyriaTaiwanThailandTrinidad and TobagoTurkeyUgandaUkraineUruguayUzbekistanVenezuelaVietnamWest IndiesWestern AfricaWestern AsiaWestern EuropeYemenZaireZimbabweAzores
Professional Degree
Income
Poverty
Unemployment
Labor Participation
Family Structure
Vehicle Availability
Education Level
Disability

Professional Degree Comparison

Bhutanese

Immigrants from Iraq

Exceptional
Poor
5.4%
PROFESSIONAL DEGREE
99.8/ 100
METRIC RATING
70th/ 347
METRIC RANK
4.2%
PROFESSIONAL DEGREE
17.1/ 100
METRIC RATING
202nd/ 347
METRIC RANK

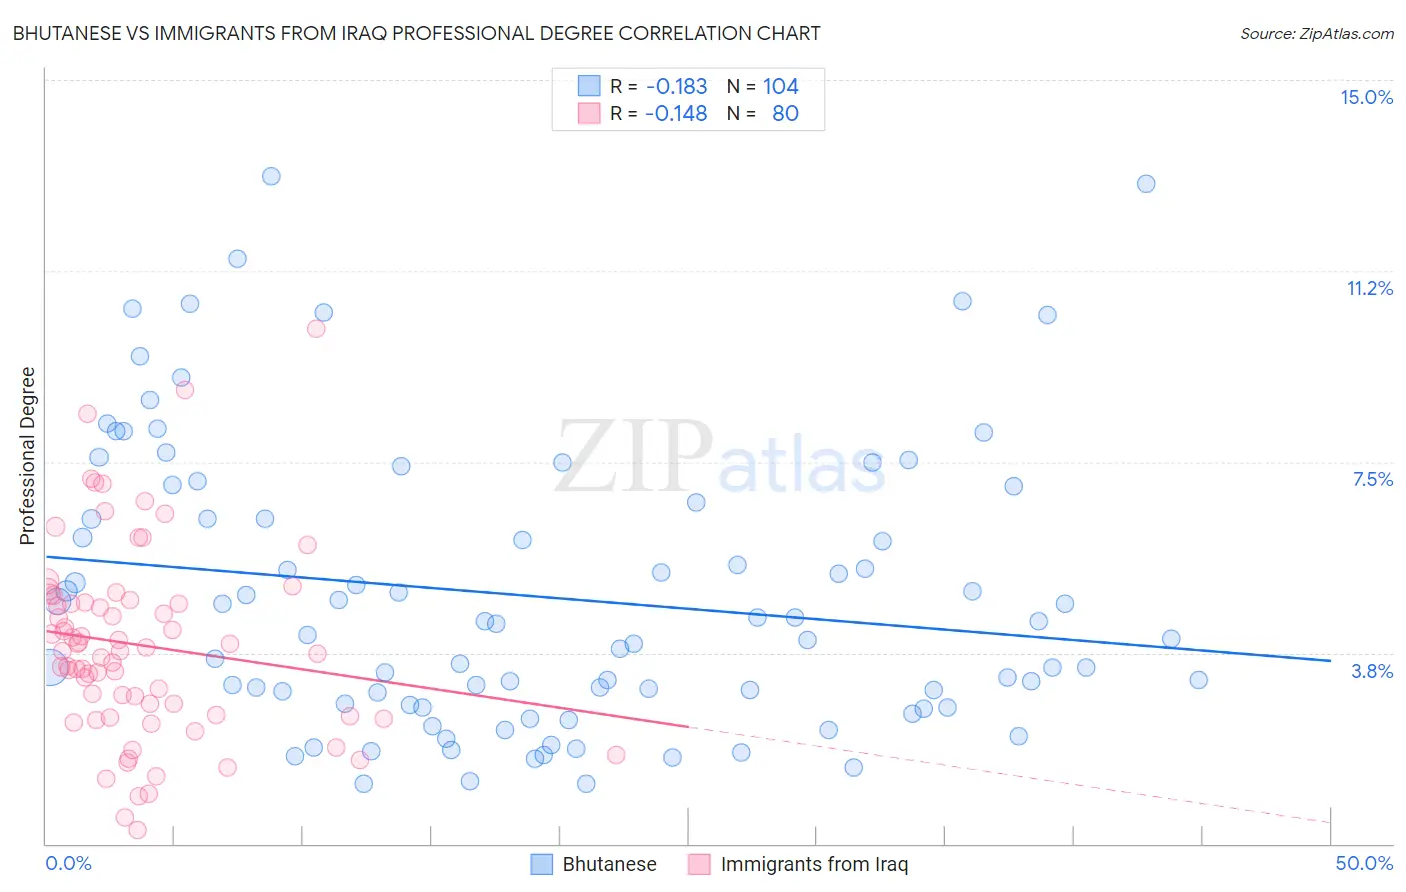
Bhutanese vs Immigrants from Iraq Professional Degree Correlation Chart

The statistical analysis conducted on geographies consisting of 454,048,564 people shows a poor negative correlation between the proportion of Bhutanese and percentage of population with at least professional degree education in the United States with a correlation coefficient (R) of -0.183 and weighted average of 5.4%. Similarly, the statistical analysis conducted on geographies consisting of 194,678,342 people shows a poor negative correlation between the proportion of Immigrants from Iraq and percentage of population with at least professional degree education in the United States with a correlation coefficient (R) of -0.148 and weighted average of 4.2%, a difference of 30.9%.
Bhutanese vs Immigrants from Iraq Professional Degree

Professional Degree Correlation Summary

MeasurementBhutaneseImmigrants from Iraq
Minimum1.2%0.28%
Maximum13.1%10.1%
Range12.0%9.8%
Mean4.9%3.9%
Median4.2%3.8%
Interquartile 25% (IQ1)2.7%2.5%
Interquartile 75% (IQ3)6.6%4.8%
Interquartile Range (IQR)3.8%2.2%
Standard Deviation (Sample)2.8%1.9%
Standard Deviation (Population)2.8%1.9%

Similar Demographics by Professional Degree

Demographics Similar to Bhutanese by Professional Degree

In terms of professional degree, the demographic groups most similar to Bhutanese are Immigrants from Hungary (5.5%, a difference of 0.33%), Immigrants from Lebanon (5.5%, a difference of 0.41%), Immigrants from Bulgaria (5.5%, a difference of 0.59%), Immigrants from Western Asia (5.4%, a difference of 0.59%), and Immigrants from Kazakhstan (5.5%, a difference of 0.92%).
DemographicsRating | RankProfessional Degree
Asians
99.9
/100
|
#63
Exceptional
5.5%
Immigrants | Asia
99.9
/100
|
#64
Exceptional
5.5%
Immigrants | Bolivia
99.9
/100
|
#65
Exceptional
5.5%
Immigrants | Kazakhstan
99.9
/100
|
#66
Exceptional
5.5%
Immigrants | Bulgaria
99.9
/100
|
#67
Exceptional
5.5%
Immigrants | Lebanon
99.9
/100
|
#68
Exceptional
5.5%
Immigrants | Hungary
99.9
/100
|
#69
Exceptional
5.5%
Bhutanese
99.8
/100
|
#70
Exceptional
5.4%
Immigrants | Western Asia
99.8
/100
|
#71
Exceptional
5.4%
Lithuanians
99.8
/100
|
#72
Exceptional
5.4%
Immigrants | Romania
99.8
/100
|
#73
Exceptional
5.4%
Ethiopians
99.7
/100
|
#74
Exceptional
5.4%
Immigrants | Indonesia
99.7
/100
|
#75
Exceptional
5.3%
Immigrants | Canada
99.7
/100
|
#76
Exceptional
5.3%
Immigrants | Ethiopia
99.7
/100
|
#77
Exceptional
5.3%

Demographics Similar to Immigrants from Iraq by Professional Degree

In terms of professional degree, the demographic groups most similar to Immigrants from Iraq are Panamanian (4.1%, a difference of 0.33%), Barbadian (4.1%, a difference of 0.36%), Finnish (4.2%, a difference of 0.43%), Somali (4.1%, a difference of 0.68%), and Immigrants from North Macedonia (4.2%, a difference of 0.79%).
DemographicsRating | RankProfessional Degree
Nigerians
24.6
/100
|
#195
Fair
4.2%
Spanish
23.0
/100
|
#196
Fair
4.2%
Czechoslovakians
22.4
/100
|
#197
Fair
4.2%
Immigrants | Middle Africa
22.1
/100
|
#198
Fair
4.2%
Norwegians
20.5
/100
|
#199
Fair
4.2%
Immigrants | North Macedonia
20.2
/100
|
#200
Fair
4.2%
Finns
18.7
/100
|
#201
Poor
4.2%
Immigrants | Iraq
17.1
/100
|
#202
Poor
4.2%
Panamanians
15.9
/100
|
#203
Poor
4.1%
Barbadians
15.8
/100
|
#204
Poor
4.1%
Somalis
14.8
/100
|
#205
Poor
4.1%
Yugoslavians
13.4
/100
|
#206
Poor
4.1%
Sub-Saharan Africans
12.8
/100
|
#207
Poor
4.1%
Immigrants | Somalia
12.5
/100
|
#208
Poor
4.1%
Immigrants | Panama
12.3
/100
|
#209
Poor
4.1%