Immigrants from Cuba vs Venezuelan Doctorate Degree
COMPARE
Immigrants from Cuba
Venezuelan
Doctorate Degree
Doctorate Degree Comparison
Immigrants from Cuba
Venezuelans
1.2%
DOCTORATE DEGREE
0.0/ 100
METRIC RATING
340th/ 347
METRIC RANK
1.7%
DOCTORATE DEGREE
19.5/ 100
METRIC RATING
205th/ 347
METRIC RANK
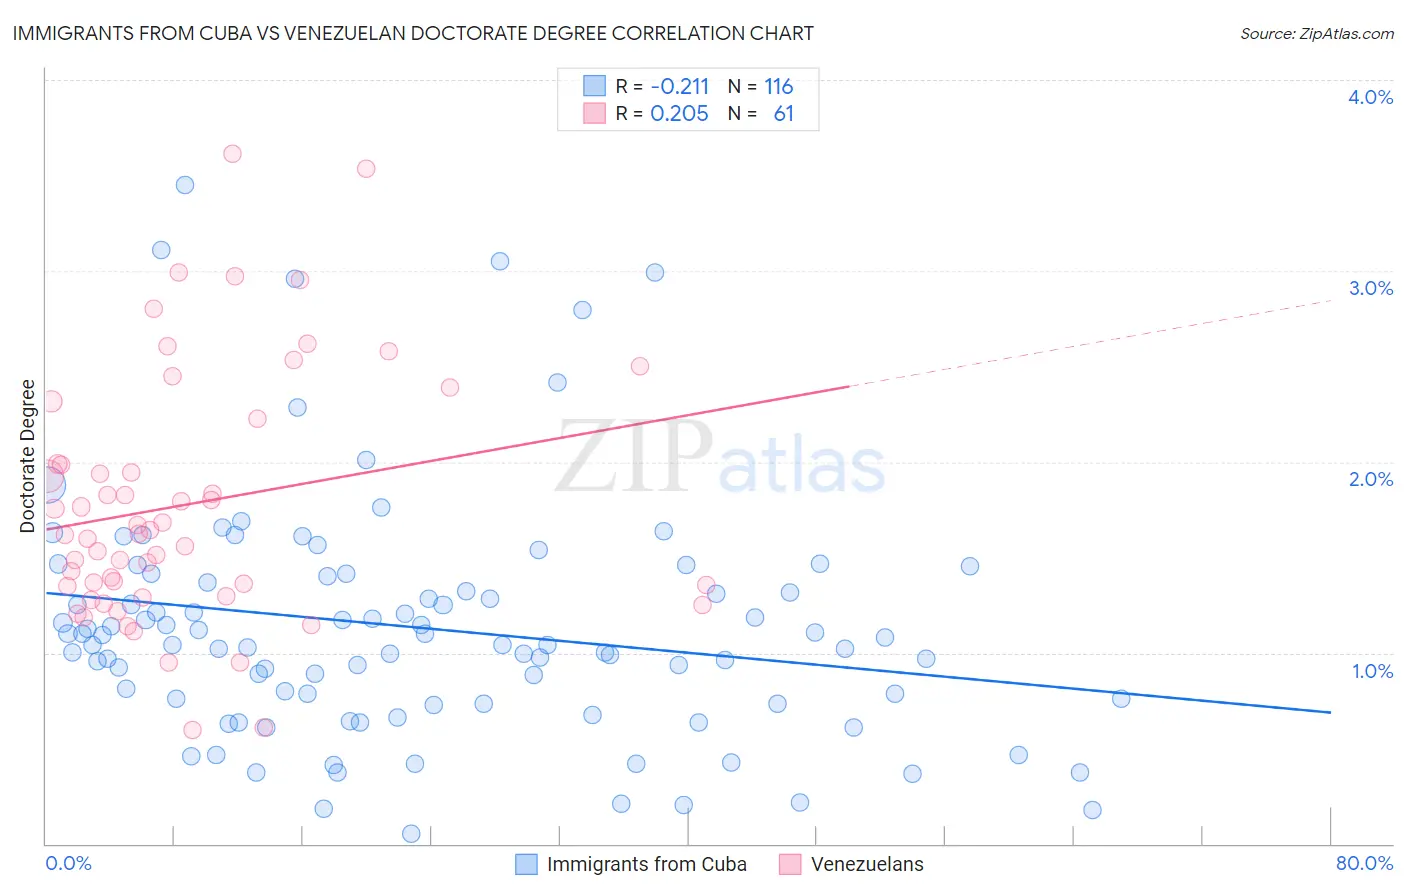
Immigrants from Cuba vs Venezuelan Doctorate Degree Correlation Chart
The statistical analysis conducted on geographies consisting of 323,189,632 people shows a weak negative correlation between the proportion of Immigrants from Cuba and percentage of population with at least doctorate degree education in the United States with a correlation coefficient (R) of -0.211 and weighted average of 1.2%. Similarly, the statistical analysis conducted on geographies consisting of 304,663,259 people shows a weak positive correlation between the proportion of Venezuelans and percentage of population with at least doctorate degree education in the United States with a correlation coefficient (R) of 0.205 and weighted average of 1.7%, a difference of 48.1%.
Doctorate Degree Correlation Summary
| Measurement | Immigrants from Cuba | Venezuelan |
| Minimum | 0.055% | 0.59% |
| Maximum | 3.4% | 3.6% |
| Range | 3.4% | 3.0% |
| Mean | 1.1% | 1.8% |
| Median | 1.0% | 1.6% |
| Interquartile 25% (IQ1) | 0.75% | 1.3% |
| Interquartile 75% (IQ3) | 1.4% | 2.1% |
| Interquartile Range (IQR) | 0.64% | 0.78% |
| Standard Deviation (Sample) | 0.63% | 0.66% |
| Standard Deviation (Population) | 0.63% | 0.65% |
Similar Demographics by Doctorate Degree
Demographics Similar to Immigrants from Cuba by Doctorate Degree
In terms of doctorate degree, the demographic groups most similar to Immigrants from Cuba are Mexican (1.2%, a difference of 0.48%), Immigrants from Central America (1.2%, a difference of 0.81%), Arapaho (1.2%, a difference of 0.86%), Puget Sound Salish (1.2%, a difference of 2.1%), and Bangladeshi (1.2%, a difference of 2.9%).
| Demographics | Rating | Rank | Doctorate Degree |
| Immigrants | Caribbean | 0.0 /100 | #333 | Tragic 1.3% |
| Immigrants | Dominican Republic | 0.0 /100 | #334 | Tragic 1.3% |
| Immigrants | Haiti | 0.0 /100 | #335 | Tragic 1.3% |
| Nepalese | 0.0 /100 | #336 | Tragic 1.3% |
| Bangladeshis | 0.0 /100 | #337 | Tragic 1.2% |
| Puget Sound Salish | 0.0 /100 | #338 | Tragic 1.2% |
| Immigrants | Central America | 0.0 /100 | #339 | Tragic 1.2% |
| Immigrants | Cuba | 0.0 /100 | #340 | Tragic 1.2% |
| Mexicans | 0.0 /100 | #341 | Tragic 1.2% |
| Arapaho | 0.0 /100 | #342 | Tragic 1.2% |
| Fijians | 0.0 /100 | #343 | Tragic 1.1% |
| Immigrants | Mexico | 0.0 /100 | #344 | Tragic 1.1% |
| Lumbee | 0.0 /100 | #345 | Tragic 1.1% |
| Spanish American Indians | 0.0 /100 | #346 | Tragic 1.1% |
| Houma | 0.0 /100 | #347 | Tragic 0.96% |
Demographics Similar to Venezuelans by Doctorate Degree
In terms of doctorate degree, the demographic groups most similar to Venezuelans are Somali (1.7%, a difference of 0.41%), Immigrants from Vietnam (1.8%, a difference of 0.44%), Portuguese (1.8%, a difference of 0.46%), Immigrants from Peru (1.7%, a difference of 0.48%), and Yugoslavian (1.7%, a difference of 0.64%).
| Demographics | Rating | Rank | Doctorate Degree |
| Immigrants | Ghana | 24.6 /100 | #198 | Fair 1.8% |
| Immigrants | South America | 23.3 /100 | #199 | Fair 1.8% |
| Whites/Caucasians | 22.8 /100 | #200 | Fair 1.8% |
| Immigrants | Nigeria | 22.4 /100 | #201 | Fair 1.8% |
| Portuguese | 21.4 /100 | #202 | Fair 1.8% |
| Immigrants | Vietnam | 21.4 /100 | #203 | Fair 1.8% |
| Somalis | 21.2 /100 | #204 | Fair 1.7% |
| Venezuelans | 19.5 /100 | #205 | Poor 1.7% |
| Immigrants | Peru | 17.6 /100 | #206 | Poor 1.7% |
| Yugoslavians | 17.1 /100 | #207 | Poor 1.7% |
| Colombians | 16.1 /100 | #208 | Poor 1.7% |
| Immigrants | Western Africa | 15.4 /100 | #209 | Poor 1.7% |
| Tongans | 15.1 /100 | #210 | Poor 1.7% |
| Immigrants | Armenia | 15.1 /100 | #211 | Poor 1.7% |
| Immigrants | South Eastern Asia | 14.7 /100 | #212 | Poor 1.7% |