Native/Alaskan vs Venezuelan Doctorate Degree
COMPARE
Native/Alaskan
Venezuelan
Doctorate Degree
Doctorate Degree Comparison
Natives/Alaskans
Venezuelans
1.3%
DOCTORATE DEGREE
0.0/ 100
METRIC RATING
324th/ 347
METRIC RANK
1.7%
DOCTORATE DEGREE
19.5/ 100
METRIC RATING
205th/ 347
METRIC RANK
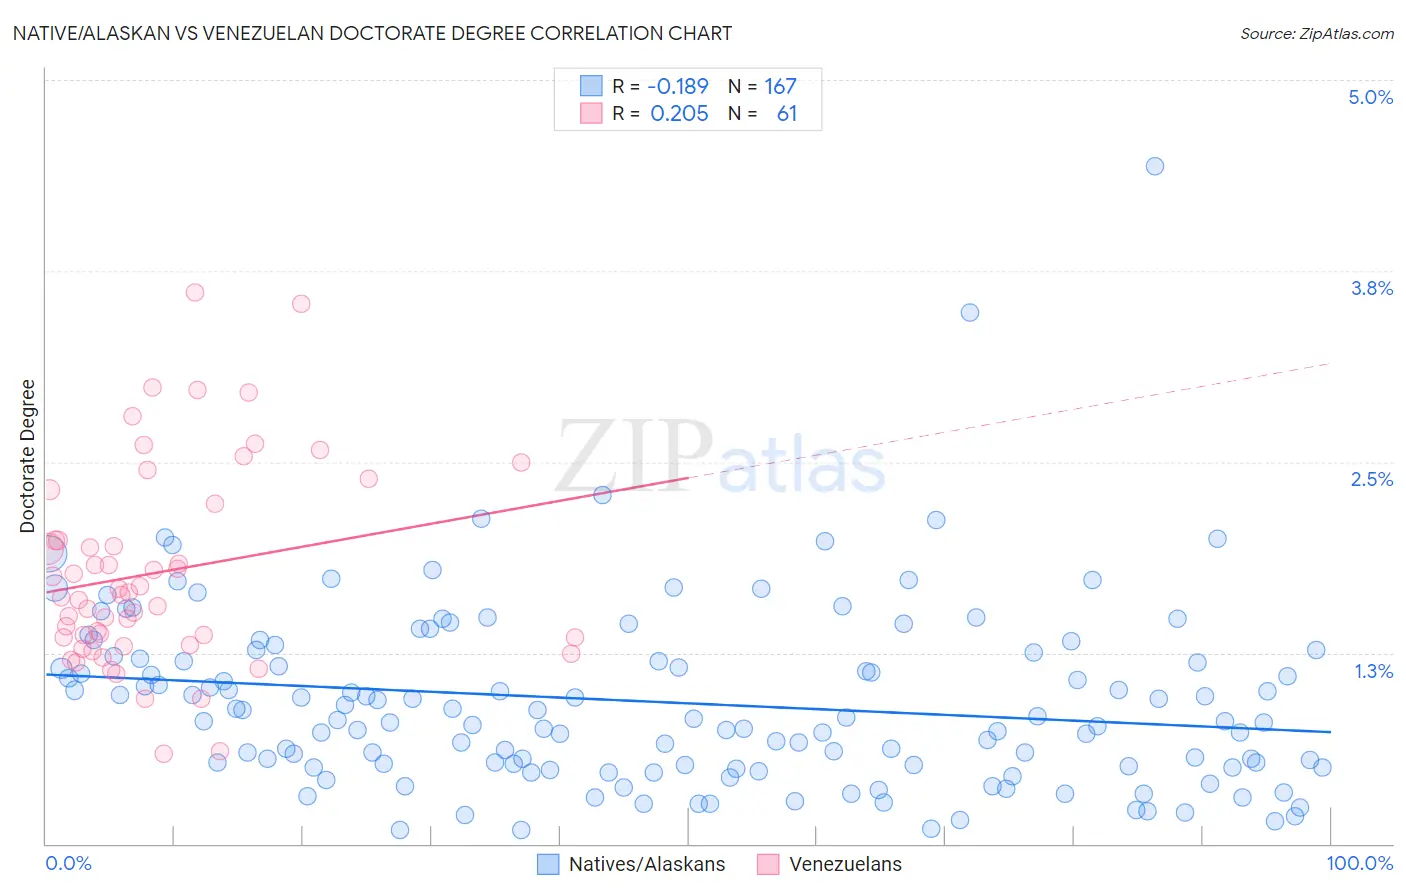
Native/Alaskan vs Venezuelan Doctorate Degree Correlation Chart
The statistical analysis conducted on geographies consisting of 497,415,117 people shows a poor negative correlation between the proportion of Natives/Alaskans and percentage of population with at least doctorate degree education in the United States with a correlation coefficient (R) of -0.189 and weighted average of 1.3%. Similarly, the statistical analysis conducted on geographies consisting of 304,663,259 people shows a weak positive correlation between the proportion of Venezuelans and percentage of population with at least doctorate degree education in the United States with a correlation coefficient (R) of 0.205 and weighted average of 1.7%, a difference of 31.7%.
Doctorate Degree Correlation Summary
| Measurement | Native/Alaskan | Venezuelan |
| Minimum | 0.087% | 0.59% |
| Maximum | 4.4% | 3.6% |
| Range | 4.3% | 3.0% |
| Mean | 0.93% | 1.8% |
| Median | 0.81% | 1.6% |
| Interquartile 25% (IQ1) | 0.51% | 1.3% |
| Interquartile 75% (IQ3) | 1.2% | 2.1% |
| Interquartile Range (IQR) | 0.72% | 0.78% |
| Standard Deviation (Sample) | 0.60% | 0.66% |
| Standard Deviation (Population) | 0.60% | 0.65% |
Similar Demographics by Doctorate Degree
Demographics Similar to Natives/Alaskans by Doctorate Degree
In terms of doctorate degree, the demographic groups most similar to Natives/Alaskans are Immigrants from Belize (1.3%, a difference of 0.32%), Pima (1.3%, a difference of 0.39%), Immigrants from Cabo Verde (1.3%, a difference of 0.41%), Seminole (1.3%, a difference of 0.52%), and Dutch West Indian (1.3%, a difference of 0.58%).
| Demographics | Rating | Rank | Doctorate Degree |
| Immigrants | Micronesia | 0.1 /100 | #317 | Tragic 1.3% |
| Creek | 0.1 /100 | #318 | Tragic 1.3% |
| Immigrants | Guyana | 0.1 /100 | #319 | Tragic 1.3% |
| Immigrants | St. Vincent and the Grenadines | 0.1 /100 | #320 | Tragic 1.3% |
| Dutch West Indians | 0.1 /100 | #321 | Tragic 1.3% |
| Seminole | 0.1 /100 | #322 | Tragic 1.3% |
| Immigrants | Belize | 0.1 /100 | #323 | Tragic 1.3% |
| Natives/Alaskans | 0.0 /100 | #324 | Tragic 1.3% |
| Pima | 0.0 /100 | #325 | Tragic 1.3% |
| Immigrants | Cabo Verde | 0.0 /100 | #326 | Tragic 1.3% |
| Hispanics or Latinos | 0.0 /100 | #327 | Tragic 1.3% |
| Inupiat | 0.0 /100 | #328 | Tragic 1.3% |
| Haitians | 0.0 /100 | #329 | Tragic 1.3% |
| Yup'ik | 0.0 /100 | #330 | Tragic 1.3% |
| Immigrants | Latin America | 0.0 /100 | #331 | Tragic 1.3% |
Demographics Similar to Venezuelans by Doctorate Degree
In terms of doctorate degree, the demographic groups most similar to Venezuelans are Somali (1.7%, a difference of 0.41%), Immigrants from Vietnam (1.8%, a difference of 0.44%), Portuguese (1.8%, a difference of 0.46%), Immigrants from Peru (1.7%, a difference of 0.48%), and Yugoslavian (1.7%, a difference of 0.64%).
| Demographics | Rating | Rank | Doctorate Degree |
| Immigrants | Ghana | 24.6 /100 | #198 | Fair 1.8% |
| Immigrants | South America | 23.3 /100 | #199 | Fair 1.8% |
| Whites/Caucasians | 22.8 /100 | #200 | Fair 1.8% |
| Immigrants | Nigeria | 22.4 /100 | #201 | Fair 1.8% |
| Portuguese | 21.4 /100 | #202 | Fair 1.8% |
| Immigrants | Vietnam | 21.4 /100 | #203 | Fair 1.8% |
| Somalis | 21.2 /100 | #204 | Fair 1.7% |
| Venezuelans | 19.5 /100 | #205 | Poor 1.7% |
| Immigrants | Peru | 17.6 /100 | #206 | Poor 1.7% |
| Yugoslavians | 17.1 /100 | #207 | Poor 1.7% |
| Colombians | 16.1 /100 | #208 | Poor 1.7% |
| Immigrants | Western Africa | 15.4 /100 | #209 | Poor 1.7% |
| Tongans | 15.1 /100 | #210 | Poor 1.7% |
| Immigrants | Armenia | 15.1 /100 | #211 | Poor 1.7% |
| Immigrants | South Eastern Asia | 14.7 /100 | #212 | Poor 1.7% |