Laotian vs Immigrants from Western Africa 8th Grade
COMPARE
Laotian
Immigrants from Western Africa
8th Grade
8th Grade Comparison
Laotians
Immigrants from Western Africa
95.4%
8TH GRADE
9.0/ 100
METRIC RATING
213th/ 347
METRIC RANK
94.8%
8TH GRADE
0.2/ 100
METRIC RATING
273rd/ 347
METRIC RANK
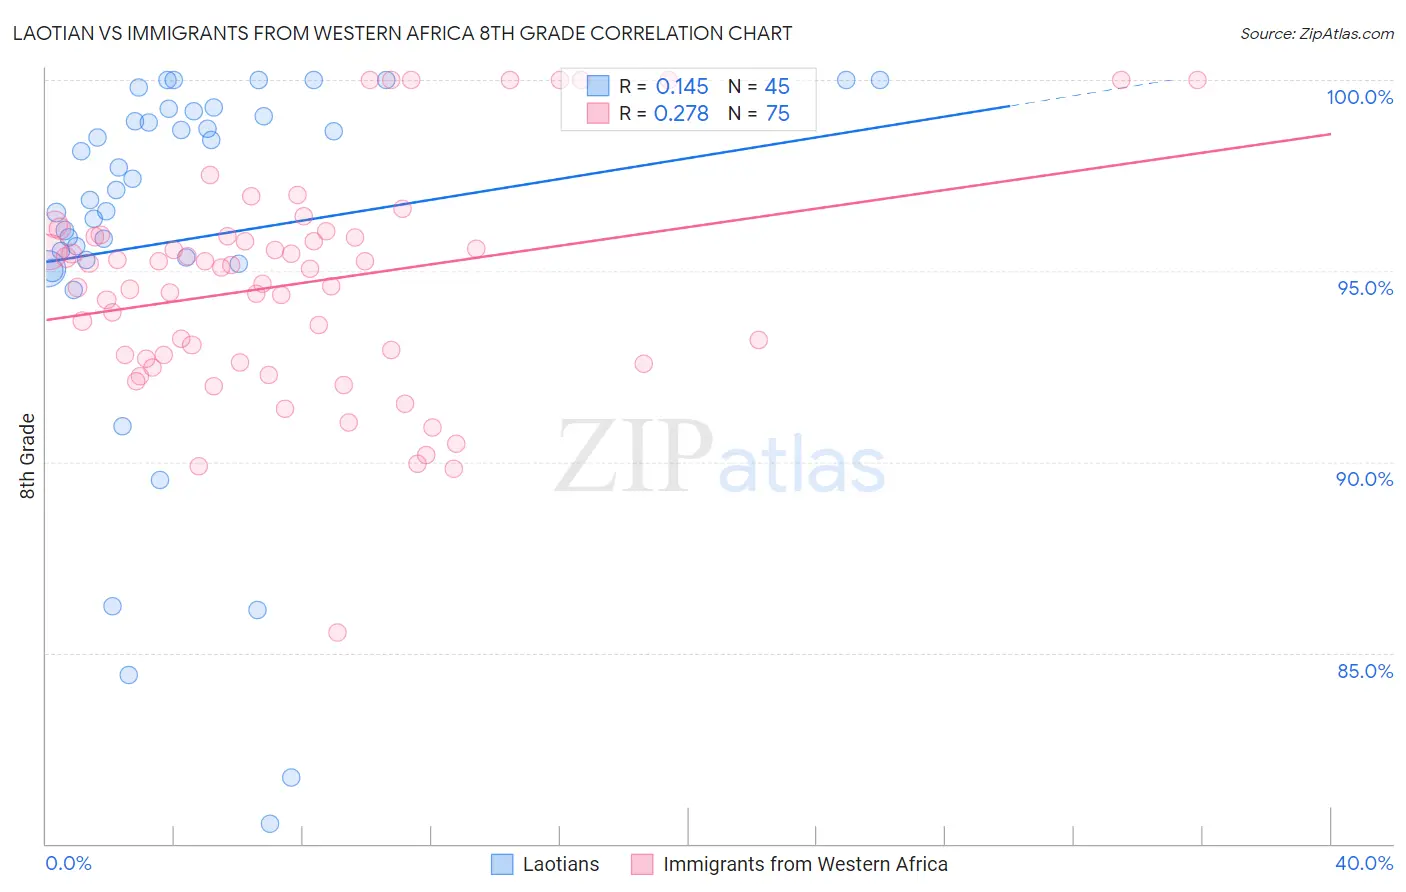
Laotian vs Immigrants from Western Africa 8th Grade Correlation Chart
The statistical analysis conducted on geographies consisting of 224,856,886 people shows a poor positive correlation between the proportion of Laotians and percentage of population with at least 8th grade education in the United States with a correlation coefficient (R) of 0.145 and weighted average of 95.4%. Similarly, the statistical analysis conducted on geographies consisting of 357,883,667 people shows a weak positive correlation between the proportion of Immigrants from Western Africa and percentage of population with at least 8th grade education in the United States with a correlation coefficient (R) of 0.278 and weighted average of 94.8%, a difference of 0.65%.
8th Grade Correlation Summary
| Measurement | Laotian | Immigrants from Western Africa |
| Minimum | 80.5% | 85.5% |
| Maximum | 100.0% | 100.0% |
| Range | 19.5% | 14.5% |
| Mean | 95.8% | 94.7% |
| Median | 97.1% | 95.1% |
| Interquartile 25% (IQ1) | 95.2% | 92.7% |
| Interquartile 75% (IQ3) | 99.1% | 95.9% |
| Interquartile Range (IQR) | 3.9% | 3.2% |
| Standard Deviation (Sample) | 4.9% | 2.9% |
| Standard Deviation (Population) | 4.9% | 2.9% |
Similar Demographics by 8th Grade
Demographics Similar to Laotians by 8th Grade
In terms of 8th grade, the demographic groups most similar to Laotians are Immigrants from Chile (95.4%, a difference of 0.0%), Immigrants from Liberia (95.4%, a difference of 0.0%), Immigrants from Pakistan (95.4%, a difference of 0.010%), Samoan (95.4%, a difference of 0.010%), and Immigrants from Eastern Asia (95.4%, a difference of 0.020%).
| Demographics | Rating | Rank | 8th Grade |
| Comanche | 16.3 /100 | #206 | Poor 95.5% |
| Immigrants | Sudan | 15.1 /100 | #207 | Poor 95.5% |
| Portuguese | 14.3 /100 | #208 | Poor 95.5% |
| Immigrants | Lebanon | 13.7 /100 | #209 | Poor 95.4% |
| Africans | 13.6 /100 | #210 | Poor 95.4% |
| Immigrants | Morocco | 12.4 /100 | #211 | Poor 95.4% |
| Immigrants | Pakistan | 9.7 /100 | #212 | Tragic 95.4% |
| Laotians | 9.0 /100 | #213 | Tragic 95.4% |
| Immigrants | Chile | 9.0 /100 | #214 | Tragic 95.4% |
| Immigrants | Liberia | 8.9 /100 | #215 | Tragic 95.4% |
| Samoans | 8.4 /100 | #216 | Tragic 95.4% |
| Immigrants | Eastern Asia | 8.3 /100 | #217 | Tragic 95.4% |
| Dutch West Indians | 8.1 /100 | #218 | Tragic 95.4% |
| Spanish Americans | 8.0 /100 | #219 | Tragic 95.4% |
| Immigrants | Southern Europe | 7.7 /100 | #220 | Tragic 95.3% |
Demographics Similar to Immigrants from Western Africa by 8th Grade
In terms of 8th grade, the demographic groups most similar to Immigrants from Western Africa are Immigrants from South America (94.8%, a difference of 0.0%), Immigrants from Afghanistan (94.8%, a difference of 0.010%), Trinidadian and Tobagonian (94.7%, a difference of 0.010%), Immigrants from Uzbekistan (94.8%, a difference of 0.020%), and Immigrants from Colombia (94.7%, a difference of 0.020%).
| Demographics | Rating | Rank | 8th Grade |
| West Indians | 0.3 /100 | #266 | Tragic 94.8% |
| Immigrants | Ghana | 0.3 /100 | #267 | Tragic 94.8% |
| Immigrants | Uruguay | 0.3 /100 | #268 | Tragic 94.8% |
| Immigrants | Thailand | 0.2 /100 | #269 | Tragic 94.8% |
| Immigrants | Uzbekistan | 0.2 /100 | #270 | Tragic 94.8% |
| Immigrants | Afghanistan | 0.2 /100 | #271 | Tragic 94.8% |
| Immigrants | South America | 0.2 /100 | #272 | Tragic 94.8% |
| Immigrants | Western Africa | 0.2 /100 | #273 | Tragic 94.8% |
| Trinidadians and Tobagonians | 0.2 /100 | #274 | Tragic 94.7% |
| Immigrants | Colombia | 0.2 /100 | #275 | Tragic 94.7% |
| Peruvians | 0.1 /100 | #276 | Tragic 94.7% |
| Taiwanese | 0.1 /100 | #277 | Tragic 94.7% |
| Armenians | 0.1 /100 | #278 | Tragic 94.7% |
| Immigrants | Trinidad and Tobago | 0.1 /100 | #279 | Tragic 94.6% |
| Barbadians | 0.1 /100 | #280 | Tragic 94.6% |