Belizean vs Immigrants from Poland 5th Grade
COMPARE
Belizean
Immigrants from Poland
5th Grade
5th Grade Comparison
Belizeans
Immigrants from Poland
95.8%
5TH GRADE
0.0/ 100
METRIC RATING
317th/ 347
METRIC RANK
97.4%
5TH GRADE
57.9/ 100
METRIC RATING
165th/ 347
METRIC RANK
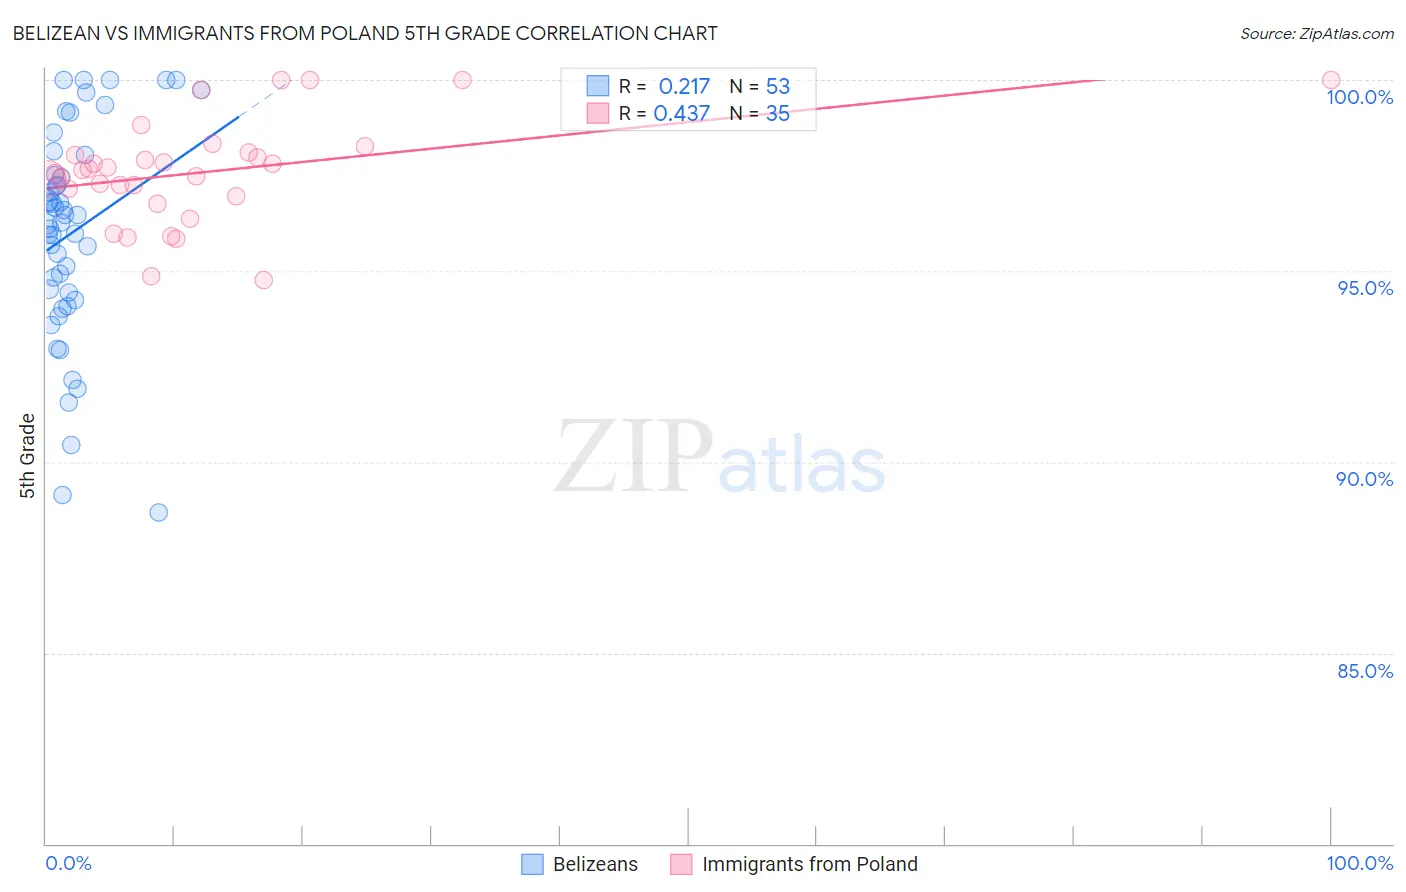
Belizean vs Immigrants from Poland 5th Grade Correlation Chart
The statistical analysis conducted on geographies consisting of 144,224,236 people shows a weak positive correlation between the proportion of Belizeans and percentage of population with at least 5th grade education in the United States with a correlation coefficient (R) of 0.217 and weighted average of 95.8%. Similarly, the statistical analysis conducted on geographies consisting of 304,861,559 people shows a moderate positive correlation between the proportion of Immigrants from Poland and percentage of population with at least 5th grade education in the United States with a correlation coefficient (R) of 0.437 and weighted average of 97.4%, a difference of 1.6%.
5th Grade Correlation Summary
| Measurement | Belizean | Immigrants from Poland |
| Minimum | 88.7% | 94.8% |
| Maximum | 100.0% | 100.0% |
| Range | 11.3% | 5.2% |
| Mean | 96.0% | 97.6% |
| Median | 96.3% | 97.6% |
| Interquartile 25% (IQ1) | 94.3% | 97.0% |
| Interquartile 75% (IQ3) | 97.8% | 98.1% |
| Interquartile Range (IQR) | 3.4% | 1.1% |
| Standard Deviation (Sample) | 2.8% | 1.3% |
| Standard Deviation (Population) | 2.7% | 1.3% |
Similar Demographics by 5th Grade
Demographics Similar to Belizeans by 5th Grade
In terms of 5th grade, the demographic groups most similar to Belizeans are Immigrants from Ecuador (95.8%, a difference of 0.030%), Immigrants from Vietnam (95.8%, a difference of 0.030%), Japanese (95.7%, a difference of 0.070%), Central American Indian (95.7%, a difference of 0.070%), and Nicaraguan (95.9%, a difference of 0.090%).
| Demographics | Rating | Rank | 5th Grade |
| Indonesians | 0.0 /100 | #310 | Tragic 96.0% |
| Immigrants | Bangladesh | 0.0 /100 | #311 | Tragic 96.0% |
| Vietnamese | 0.0 /100 | #312 | Tragic 95.9% |
| Bangladeshis | 0.0 /100 | #313 | Tragic 95.9% |
| Immigrants | Portugal | 0.0 /100 | #314 | Tragic 95.9% |
| Nicaraguans | 0.0 /100 | #315 | Tragic 95.9% |
| Immigrants | Ecuador | 0.0 /100 | #316 | Tragic 95.8% |
| Belizeans | 0.0 /100 | #317 | Tragic 95.8% |
| Immigrants | Vietnam | 0.0 /100 | #318 | Tragic 95.8% |
| Japanese | 0.0 /100 | #319 | Tragic 95.7% |
| Central American Indians | 0.0 /100 | #320 | Tragic 95.7% |
| Immigrants | Belize | 0.0 /100 | #321 | Tragic 95.7% |
| Immigrants | Nicaragua | 0.0 /100 | #322 | Tragic 95.6% |
| Immigrants | Fiji | 0.0 /100 | #323 | Tragic 95.6% |
| Hondurans | 0.0 /100 | #324 | Tragic 95.6% |
Demographics Similar to Immigrants from Poland by 5th Grade
In terms of 5th grade, the demographic groups most similar to Immigrants from Poland are Ugandan (97.4%, a difference of 0.0%), Bermudan (97.4%, a difference of 0.0%), Apache (97.4%, a difference of 0.0%), Marshallese (97.4%, a difference of 0.010%), and Kenyan (97.4%, a difference of 0.010%).
| Demographics | Rating | Rank | 5th Grade |
| Albanians | 68.3 /100 | #158 | Good 97.4% |
| Immigrants | Italy | 65.2 /100 | #159 | Good 97.4% |
| Marshallese | 61.2 /100 | #160 | Good 97.4% |
| Kenyans | 59.7 /100 | #161 | Average 97.4% |
| Immigrants | Iran | 59.5 /100 | #162 | Average 97.4% |
| Ugandans | 58.9 /100 | #163 | Average 97.4% |
| Bermudans | 58.8 /100 | #164 | Average 97.4% |
| Immigrants | Poland | 57.9 /100 | #165 | Average 97.4% |
| Apache | 57.2 /100 | #166 | Average 97.4% |
| Immigrants | Belarus | 54.6 /100 | #167 | Average 97.3% |
| Chileans | 54.5 /100 | #168 | Average 97.3% |
| Immigrants | Korea | 54.1 /100 | #169 | Average 97.3% |
| Venezuelans | 54.0 /100 | #170 | Average 97.3% |
| Immigrants | Sri Lanka | 53.8 /100 | #171 | Average 97.3% |
| Arabs | 53.4 /100 | #172 | Average 97.3% |