Immigrants from Eastern Europe vs Immigrants from Poland 5th Grade
COMPARE
Immigrants from Eastern Europe
Immigrants from Poland
5th Grade
5th Grade Comparison
Immigrants from Eastern Europe
Immigrants from Poland
97.4%
5TH GRADE
75.0/ 100
METRIC RATING
151st/ 347
METRIC RANK
97.4%
5TH GRADE
57.9/ 100
METRIC RATING
165th/ 347
METRIC RANK
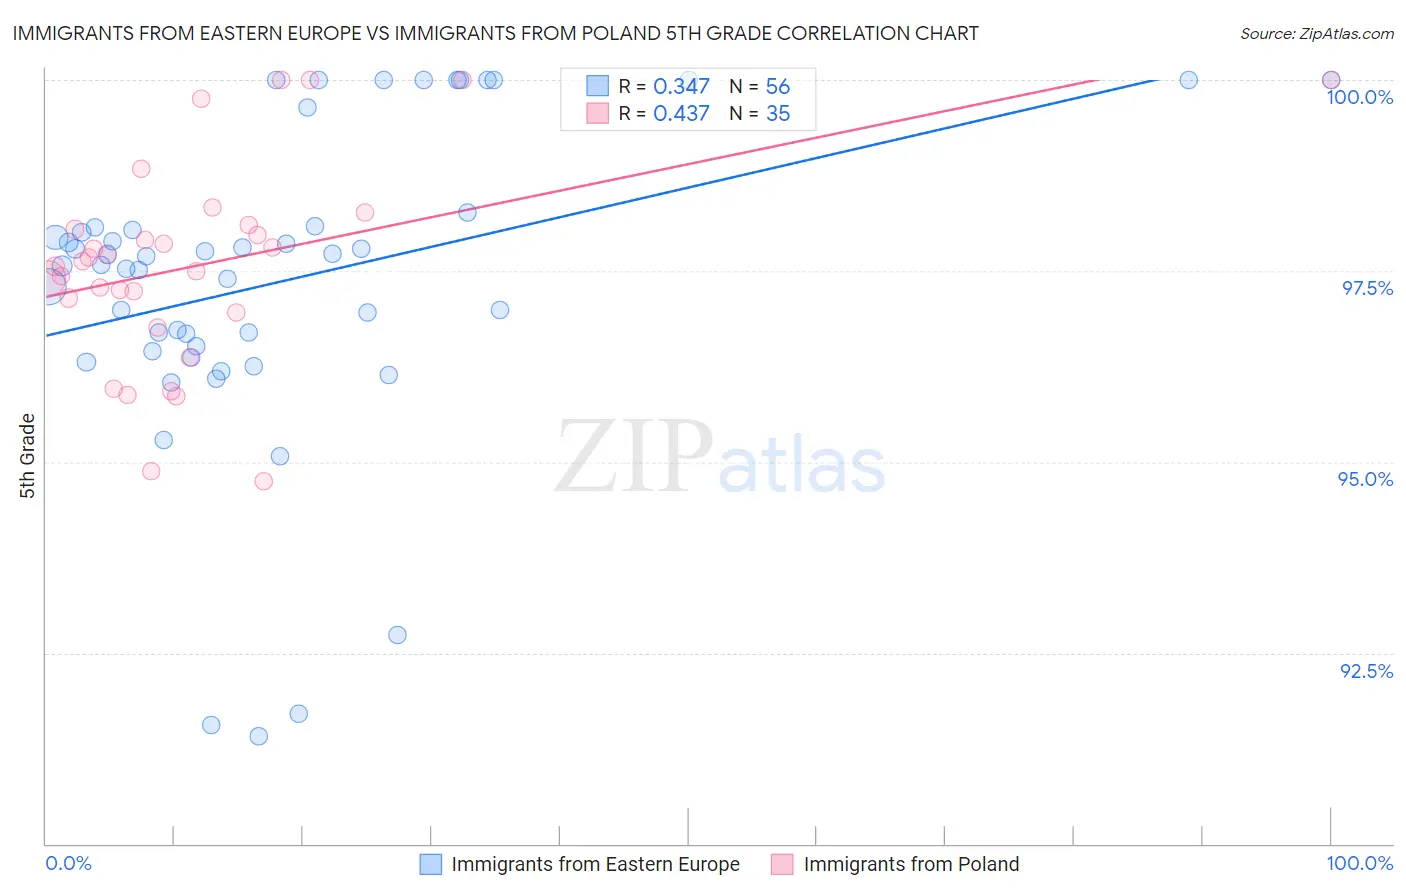
Immigrants from Eastern Europe vs Immigrants from Poland 5th Grade Correlation Chart
The statistical analysis conducted on geographies consisting of 475,879,420 people shows a mild positive correlation between the proportion of Immigrants from Eastern Europe and percentage of population with at least 5th grade education in the United States with a correlation coefficient (R) of 0.347 and weighted average of 97.4%. Similarly, the statistical analysis conducted on geographies consisting of 304,861,559 people shows a moderate positive correlation between the proportion of Immigrants from Poland and percentage of population with at least 5th grade education in the United States with a correlation coefficient (R) of 0.437 and weighted average of 97.4%, a difference of 0.080%.
5th Grade Correlation Summary
| Measurement | Immigrants from Eastern Europe | Immigrants from Poland |
| Minimum | 91.4% | 94.8% |
| Maximum | 100.0% | 100.0% |
| Range | 8.6% | 5.2% |
| Mean | 97.4% | 97.6% |
| Median | 97.6% | 97.6% |
| Interquartile 25% (IQ1) | 96.5% | 97.0% |
| Interquartile 75% (IQ3) | 98.1% | 98.1% |
| Interquartile Range (IQR) | 1.6% | 1.1% |
| Standard Deviation (Sample) | 2.1% | 1.3% |
| Standard Deviation (Population) | 2.0% | 1.3% |
Demographics Similar to Immigrants from Eastern Europe and Immigrants from Poland by 5th Grade
In terms of 5th grade, the demographic groups most similar to Immigrants from Eastern Europe are Ute (97.4%, a difference of 0.0%), Alsatian (97.4%, a difference of 0.0%), Immigrants from Israel (97.5%, a difference of 0.020%), Hopi (97.5%, a difference of 0.020%), and Immigrants from South Central Asia (97.5%, a difference of 0.020%). Similarly, the demographic groups most similar to Immigrants from Poland are Ugandan (97.4%, a difference of 0.0%), Bermudan (97.4%, a difference of 0.0%), Apache (97.4%, a difference of 0.0%), Marshallese (97.4%, a difference of 0.010%), and Kenyan (97.4%, a difference of 0.010%).
| Demographics | Rating | Rank | 5th Grade |
| Immigrants | Israel | 79.1 /100 | #148 | Good 97.5% |
| Hopi | 78.6 /100 | #149 | Good 97.5% |
| Immigrants | South Central Asia | 78.6 /100 | #150 | Good 97.5% |
| Immigrants | Eastern Europe | 75.0 /100 | #151 | Good 97.4% |
| Ute | 74.9 /100 | #152 | Good 97.4% |
| Alsatians | 74.3 /100 | #153 | Good 97.4% |
| Immigrants | Russia | 71.2 /100 | #154 | Good 97.4% |
| Immigrants | Bosnia and Herzegovina | 71.0 /100 | #155 | Good 97.4% |
| French American Indians | 70.5 /100 | #156 | Good 97.4% |
| Immigrants | Jordan | 70.4 /100 | #157 | Good 97.4% |
| Albanians | 68.3 /100 | #158 | Good 97.4% |
| Immigrants | Italy | 65.2 /100 | #159 | Good 97.4% |
| Marshallese | 61.2 /100 | #160 | Good 97.4% |
| Kenyans | 59.7 /100 | #161 | Average 97.4% |
| Immigrants | Iran | 59.5 /100 | #162 | Average 97.4% |
| Ugandans | 58.9 /100 | #163 | Average 97.4% |
| Bermudans | 58.8 /100 | #164 | Average 97.4% |
| Immigrants | Poland | 57.9 /100 | #165 | Average 97.4% |
| Apache | 57.2 /100 | #166 | Average 97.4% |
| Immigrants | Belarus | 54.6 /100 | #167 | Average 97.3% |
| Chileans | 54.5 /100 | #168 | Average 97.3% |