Barbadian vs Immigrants from Poland 5th Grade
COMPARE
Barbadian
Immigrants from Poland
5th Grade
5th Grade Comparison
Barbadians
Immigrants from Poland
96.6%
5TH GRADE
0.1/ 100
METRIC RATING
282nd/ 347
METRIC RANK
97.4%
5TH GRADE
57.9/ 100
METRIC RATING
165th/ 347
METRIC RANK
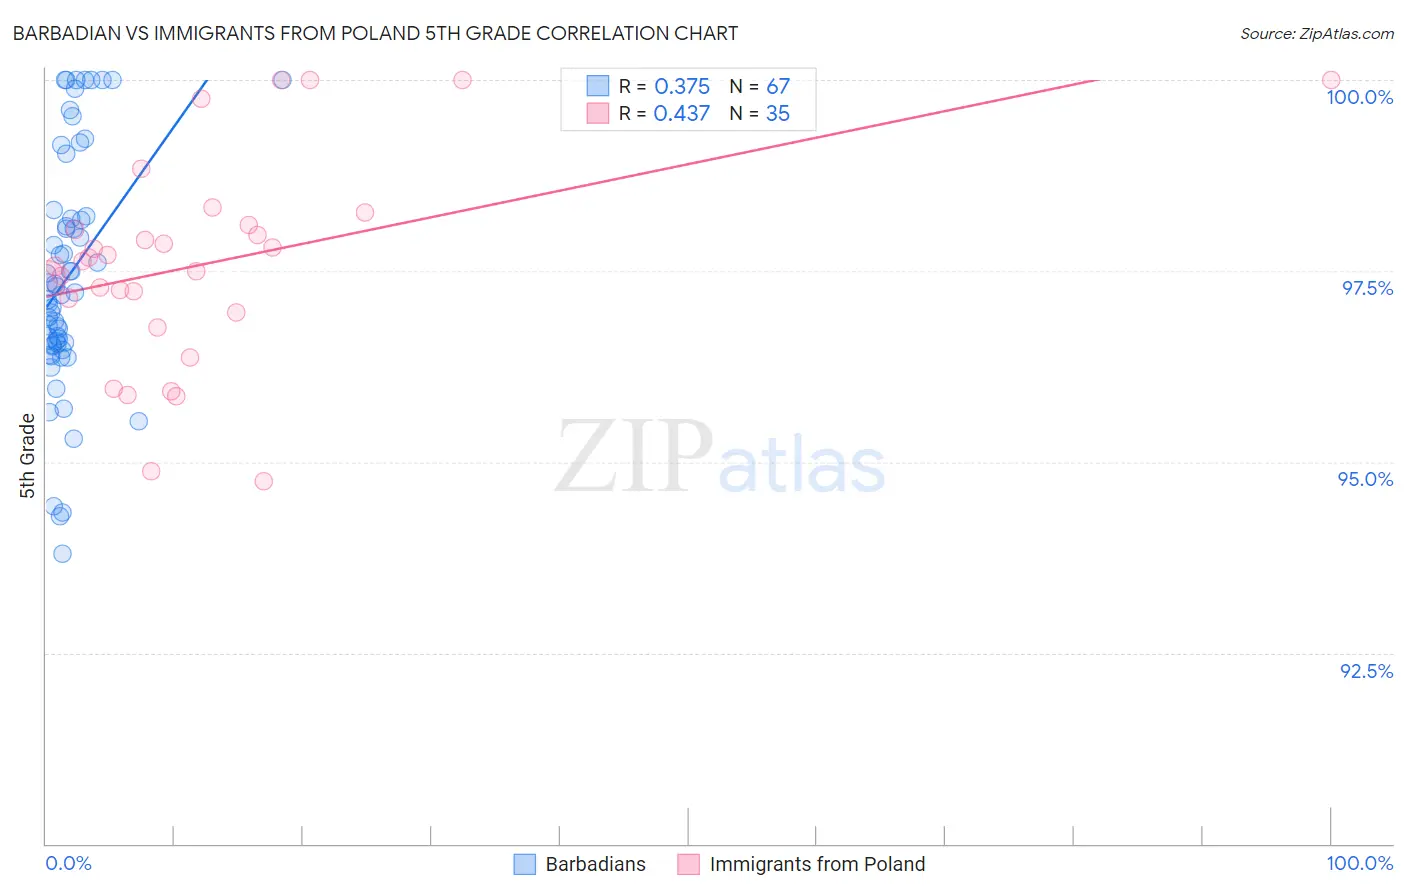
Barbadian vs Immigrants from Poland 5th Grade Correlation Chart
The statistical analysis conducted on geographies consisting of 141,304,590 people shows a mild positive correlation between the proportion of Barbadians and percentage of population with at least 5th grade education in the United States with a correlation coefficient (R) of 0.375 and weighted average of 96.6%. Similarly, the statistical analysis conducted on geographies consisting of 304,861,559 people shows a moderate positive correlation between the proportion of Immigrants from Poland and percentage of population with at least 5th grade education in the United States with a correlation coefficient (R) of 0.437 and weighted average of 97.4%, a difference of 0.77%.
5th Grade Correlation Summary
| Measurement | Barbadian | Immigrants from Poland |
| Minimum | 93.8% | 94.8% |
| Maximum | 100.0% | 100.0% |
| Range | 6.2% | 5.2% |
| Mean | 97.4% | 97.6% |
| Median | 97.2% | 97.6% |
| Interquartile 25% (IQ1) | 96.5% | 97.0% |
| Interquartile 75% (IQ3) | 98.2% | 98.1% |
| Interquartile Range (IQR) | 1.7% | 1.1% |
| Standard Deviation (Sample) | 1.5% | 1.3% |
| Standard Deviation (Population) | 1.5% | 1.3% |
Similar Demographics by 5th Grade
Demographics Similar to Barbadians by 5th Grade
In terms of 5th grade, the demographic groups most similar to Barbadians are Immigrants from Western Africa (96.6%, a difference of 0.0%), Houma (96.6%, a difference of 0.0%), Fijian (96.6%, a difference of 0.0%), Immigrants from Philippines (96.6%, a difference of 0.010%), and Immigrants from Trinidad and Tobago (96.6%, a difference of 0.010%).
| Demographics | Rating | Rank | 5th Grade |
| Immigrants | Peru | 0.1 /100 | #275 | Tragic 96.6% |
| Cubans | 0.1 /100 | #276 | Tragic 96.6% |
| Immigrants | Bolivia | 0.1 /100 | #277 | Tragic 96.6% |
| Immigrants | Ghana | 0.1 /100 | #278 | Tragic 96.6% |
| Immigrants | Philippines | 0.1 /100 | #279 | Tragic 96.6% |
| Immigrants | Western Africa | 0.1 /100 | #280 | Tragic 96.6% |
| Houma | 0.1 /100 | #281 | Tragic 96.6% |
| Barbadians | 0.1 /100 | #282 | Tragic 96.6% |
| Fijians | 0.1 /100 | #283 | Tragic 96.6% |
| Immigrants | Trinidad and Tobago | 0.1 /100 | #284 | Tragic 96.6% |
| Immigrants | St. Vincent and the Grenadines | 0.1 /100 | #285 | Tragic 96.6% |
| Immigrants | Thailand | 0.1 /100 | #286 | Tragic 96.6% |
| Immigrants | Afghanistan | 0.1 /100 | #287 | Tragic 96.6% |
| Immigrants | Barbados | 0.0 /100 | #288 | Tragic 96.6% |
| Immigrants | West Indies | 0.0 /100 | #289 | Tragic 96.5% |
Demographics Similar to Immigrants from Poland by 5th Grade
In terms of 5th grade, the demographic groups most similar to Immigrants from Poland are Ugandan (97.4%, a difference of 0.0%), Bermudan (97.4%, a difference of 0.0%), Apache (97.4%, a difference of 0.0%), Marshallese (97.4%, a difference of 0.010%), and Kenyan (97.4%, a difference of 0.010%).
| Demographics | Rating | Rank | 5th Grade |
| Albanians | 68.3 /100 | #158 | Good 97.4% |
| Immigrants | Italy | 65.2 /100 | #159 | Good 97.4% |
| Marshallese | 61.2 /100 | #160 | Good 97.4% |
| Kenyans | 59.7 /100 | #161 | Average 97.4% |
| Immigrants | Iran | 59.5 /100 | #162 | Average 97.4% |
| Ugandans | 58.9 /100 | #163 | Average 97.4% |
| Bermudans | 58.8 /100 | #164 | Average 97.4% |
| Immigrants | Poland | 57.9 /100 | #165 | Average 97.4% |
| Apache | 57.2 /100 | #166 | Average 97.4% |
| Immigrants | Belarus | 54.6 /100 | #167 | Average 97.3% |
| Chileans | 54.5 /100 | #168 | Average 97.3% |
| Immigrants | Korea | 54.1 /100 | #169 | Average 97.3% |
| Venezuelans | 54.0 /100 | #170 | Average 97.3% |
| Immigrants | Sri Lanka | 53.8 /100 | #171 | Average 97.3% |
| Arabs | 53.4 /100 | #172 | Average 97.3% |