Belizean vs Immigrants from Barbados 5th Grade
COMPARE
Belizean
Immigrants from Barbados
5th Grade
5th Grade Comparison
Belizeans
Immigrants from Barbados
95.8%
5TH GRADE
0.0/ 100
METRIC RATING
317th/ 347
METRIC RANK
96.6%
5TH GRADE
0.0/ 100
METRIC RATING
288th/ 347
METRIC RANK
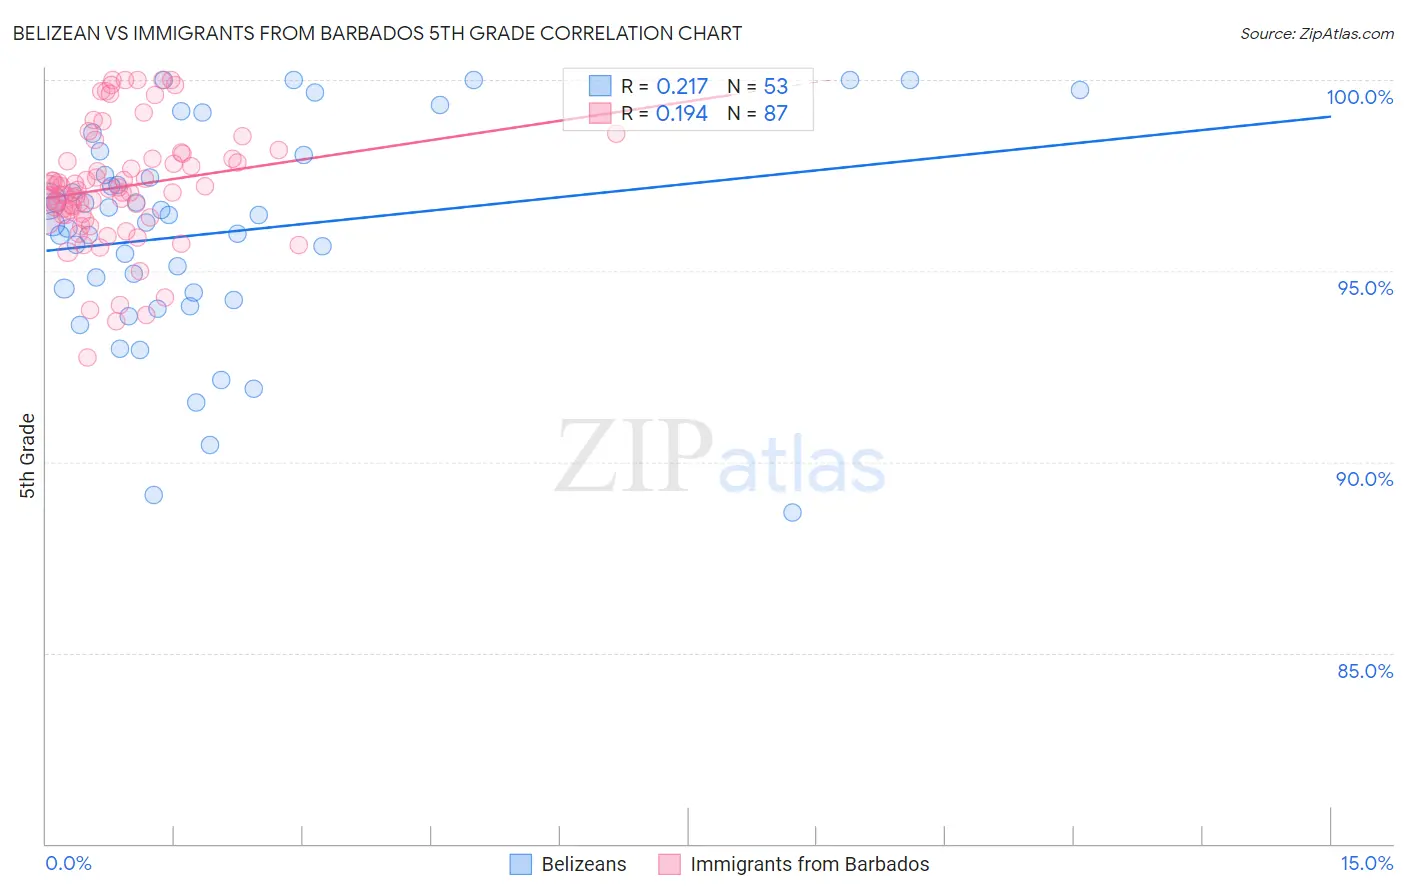
Belizean vs Immigrants from Barbados 5th Grade Correlation Chart
The statistical analysis conducted on geographies consisting of 144,224,236 people shows a weak positive correlation between the proportion of Belizeans and percentage of population with at least 5th grade education in the United States with a correlation coefficient (R) of 0.217 and weighted average of 95.8%. Similarly, the statistical analysis conducted on geographies consisting of 112,788,359 people shows a poor positive correlation between the proportion of Immigrants from Barbados and percentage of population with at least 5th grade education in the United States with a correlation coefficient (R) of 0.194 and weighted average of 96.6%, a difference of 0.79%.
5th Grade Correlation Summary
| Measurement | Belizean | Immigrants from Barbados |
| Minimum | 88.7% | 92.7% |
| Maximum | 100.0% | 100.0% |
| Range | 11.3% | 7.3% |
| Mean | 96.0% | 97.2% |
| Median | 96.3% | 97.1% |
| Interquartile 25% (IQ1) | 94.3% | 96.5% |
| Interquartile 75% (IQ3) | 97.8% | 97.9% |
| Interquartile Range (IQR) | 3.4% | 1.5% |
| Standard Deviation (Sample) | 2.8% | 1.5% |
| Standard Deviation (Population) | 2.7% | 1.5% |
Similar Demographics by 5th Grade
Demographics Similar to Belizeans by 5th Grade
In terms of 5th grade, the demographic groups most similar to Belizeans are Immigrants from Ecuador (95.8%, a difference of 0.030%), Immigrants from Vietnam (95.8%, a difference of 0.030%), Japanese (95.7%, a difference of 0.070%), Central American Indian (95.7%, a difference of 0.070%), and Nicaraguan (95.9%, a difference of 0.090%).
| Demographics | Rating | Rank | 5th Grade |
| Indonesians | 0.0 /100 | #310 | Tragic 96.0% |
| Immigrants | Bangladesh | 0.0 /100 | #311 | Tragic 96.0% |
| Vietnamese | 0.0 /100 | #312 | Tragic 95.9% |
| Bangladeshis | 0.0 /100 | #313 | Tragic 95.9% |
| Immigrants | Portugal | 0.0 /100 | #314 | Tragic 95.9% |
| Nicaraguans | 0.0 /100 | #315 | Tragic 95.9% |
| Immigrants | Ecuador | 0.0 /100 | #316 | Tragic 95.8% |
| Belizeans | 0.0 /100 | #317 | Tragic 95.8% |
| Immigrants | Vietnam | 0.0 /100 | #318 | Tragic 95.8% |
| Japanese | 0.0 /100 | #319 | Tragic 95.7% |
| Central American Indians | 0.0 /100 | #320 | Tragic 95.7% |
| Immigrants | Belize | 0.0 /100 | #321 | Tragic 95.7% |
| Immigrants | Nicaragua | 0.0 /100 | #322 | Tragic 95.6% |
| Immigrants | Fiji | 0.0 /100 | #323 | Tragic 95.6% |
| Hondurans | 0.0 /100 | #324 | Tragic 95.6% |
Demographics Similar to Immigrants from Barbados by 5th Grade
In terms of 5th grade, the demographic groups most similar to Immigrants from Barbados are Immigrants from Afghanistan (96.6%, a difference of 0.010%), Immigrants from Thailand (96.6%, a difference of 0.030%), Immigrants from St. Vincent and the Grenadines (96.6%, a difference of 0.040%), Immigrants from Trinidad and Tobago (96.6%, a difference of 0.050%), and Houma (96.6%, a difference of 0.060%).
| Demographics | Rating | Rank | 5th Grade |
| Houma | 0.1 /100 | #281 | Tragic 96.6% |
| Barbadians | 0.1 /100 | #282 | Tragic 96.6% |
| Fijians | 0.1 /100 | #283 | Tragic 96.6% |
| Immigrants | Trinidad and Tobago | 0.1 /100 | #284 | Tragic 96.6% |
| Immigrants | St. Vincent and the Grenadines | 0.1 /100 | #285 | Tragic 96.6% |
| Immigrants | Thailand | 0.1 /100 | #286 | Tragic 96.6% |
| Immigrants | Afghanistan | 0.1 /100 | #287 | Tragic 96.6% |
| Immigrants | Barbados | 0.0 /100 | #288 | Tragic 96.6% |
| Immigrants | West Indies | 0.0 /100 | #289 | Tragic 96.5% |
| British West Indians | 0.0 /100 | #290 | Tragic 96.5% |
| Malaysians | 0.0 /100 | #291 | Tragic 96.5% |
| Somalis | 0.0 /100 | #292 | Tragic 96.5% |
| Immigrants | Grenada | 0.0 /100 | #293 | Tragic 96.5% |
| Immigrants | Eritrea | 0.0 /100 | #294 | Tragic 96.4% |
| Immigrants | Somalia | 0.0 /100 | #295 | Tragic 96.4% |